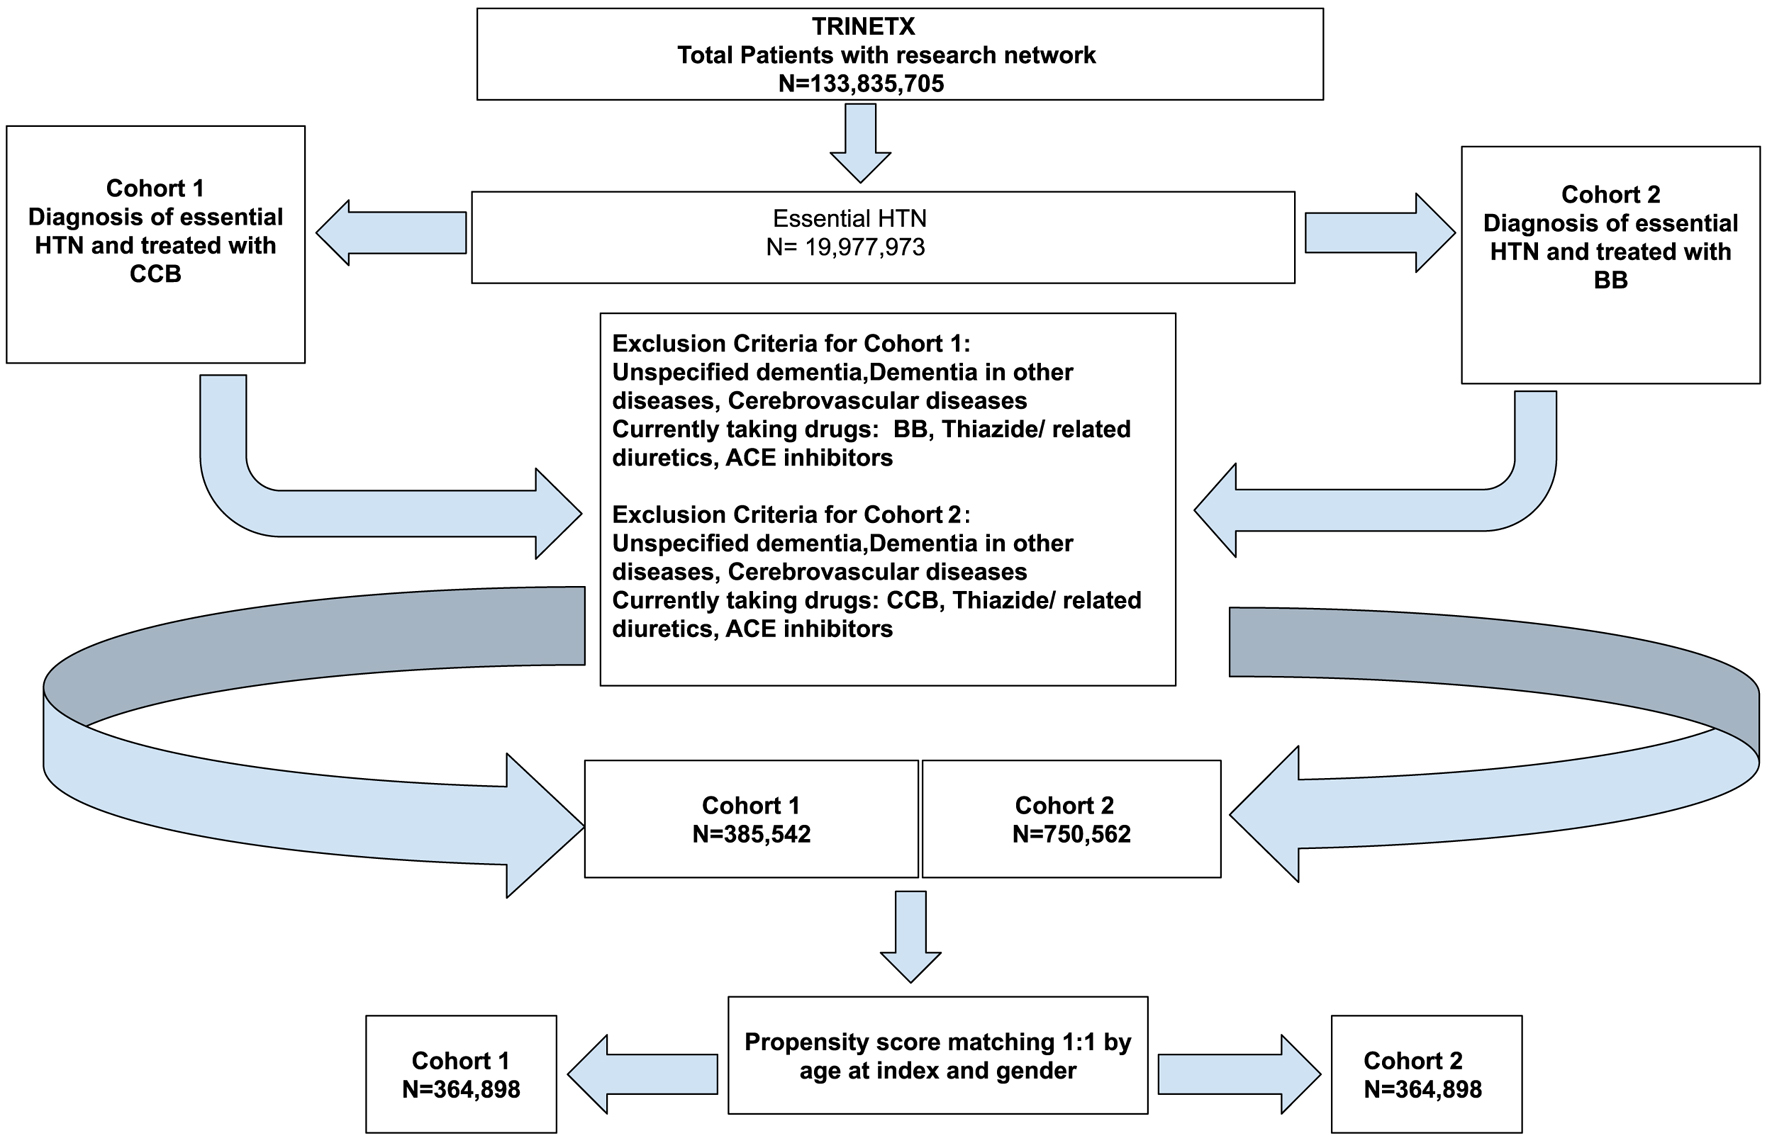
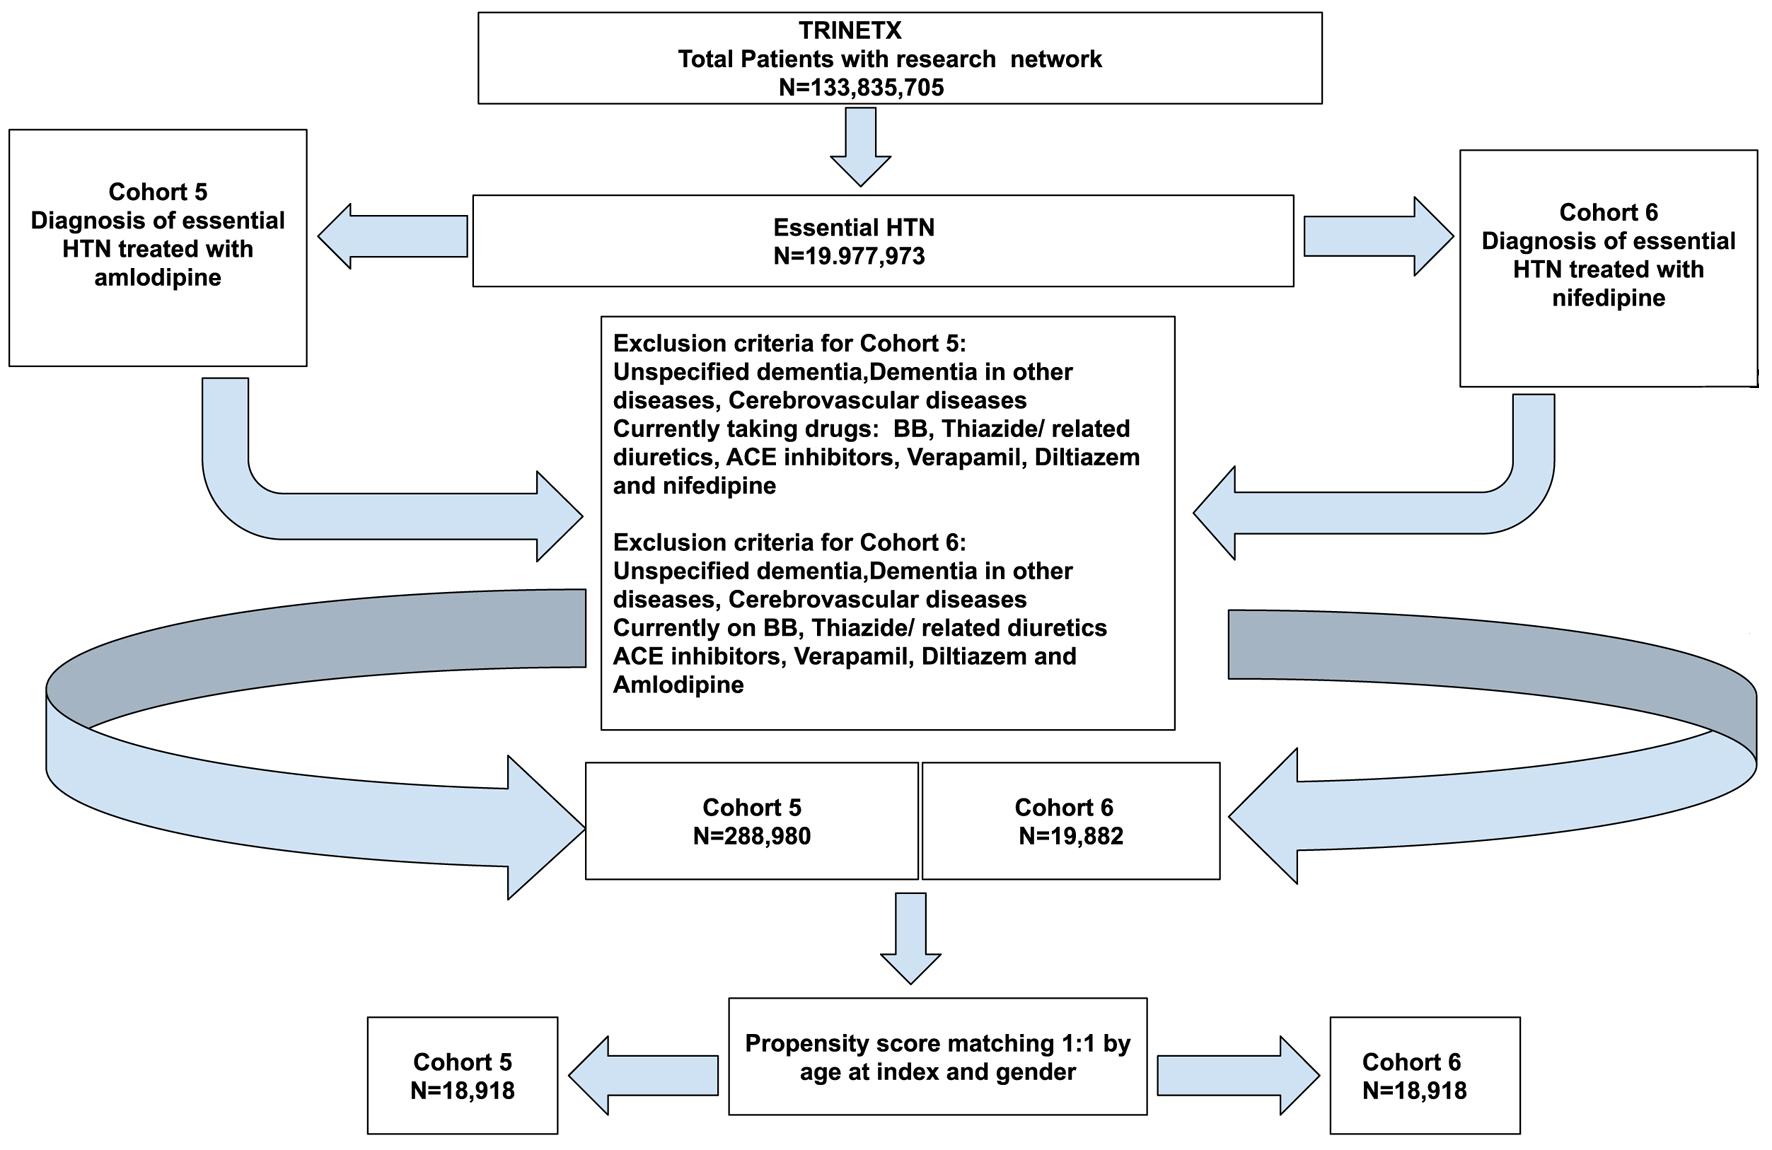
↓ Figure 1. Cohort definition flowchart for
cohort 1 (CCB) and cohort 2 (BB). ACE: angiotensin-converting enzyme; BB: beta-blocker; CCB: calcium
channel blocker.
| Journal of Neurology Research, ISSN 1923-2845 print, 1923-2853 online, Open Access |
| Article copyright, the authors; Journal compilation copyright, J Neurol Res and Elmer Press Inc |
| Journal website https://jnr.elmerpub.com |
Original Article
Volume 15, Number 3, August 2025, pages 105-116
Neuroprotective Effects of Calcium Channel Blockers on Parkinson’s Disease Development: A Population Cohort Study
Figures
Tables
| Demographics | Mean ± SD | Patients | % of cohort | P-value | Std diff. |
|---|---|---|---|---|---|
| BB: beta-blocker; CCB: calcium channel blocker; SD: standard deviation. | |||||
| Cohort 1 (N = 385,522) and cohort 2 (N = 750,562) before propensity score matching | |||||
| Age at index | < 0.001 | 0.099 | |||
| Cohort 1 | 59.6 ± 16.7 | 368,234 | 100% | ||
| Cohort 2 | 61.2 ± 15.7 | 718,165 | 100% | ||
| Female | < 0.001 | 0.037 | |||
| Cohort 1 | 189,836 | 51.6% | |||
| Cohort 2 | 356,797 | 49.7% | |||
| Male | 0.001 | 0.007 | |||
| Cohort 1 | 169,271 | 46.0% | |||
| Cohort 2 | 332,589 | 46.3% | |||
| Cohort 1 (N = 364,898) and cohort 2 (N = 364,898) after propensity score matching | |||||
| Age at index | 0.354 | 0.002 | |||
| Cohort 1 | 60.1 ± 16.0 | 364,898 | 100% | ||
| Cohort 2 | 60.1 ± 15.9 | 364,898 | 100% | ||
| Female | 0.001 | 0.008 | |||
| Cohort 1 | 187,707 | 51.4% | |||
| Cohort 2 | 189,173 | 51.8% | |||
| Male | 0.001 | 0.008 | |||
| Cohort 1 | 168,064 | 46.1% | |||
| Cohort 2 | 166,602 | 45.7% | |||
| Race | Patients | % of the cohort |
|---|---|---|
| White | 195,442 | 53.69% |
| Black/African American | 71,559 | 19.66% |
| Asian | 27,086 | 7.44% |
| Native Hawaiian/other Pacific Islander | 1,488 | 0.41% |
| American Indian/Alaska Native | 784 | 0.22% |
| Other | 13,023 | 3.63% |
| Unknown race | 54,422 | 14.95% |
| Race | Patients | % of the cohort |
|---|---|---|
| White | 500,955 | 69.81% |
| Black/African American | 61,270 | 13.5% |
| Asian | 31,371 | 4.37% |
| Native Hawaiian/other Pacific Islander | 4,467 | 0.62% |
| American Indian/Alaska Native | 1,592 | 0.22% |
| Other | 13,023 | 3.63% |
| Unknown race | 96,847 | 13.5% |
| Outcome definition | |
|---|---|
| Diagnosis (UMLS: ICD-10-CM: G20) | Parkinson’s disease |
| Settings for the performed analyses | |
| Risk analysis | Excluding patients with outcome prior to the time window |
| Kaplan-Meier survival analysis | Excluding patients with outcome prior to the time window |
| Number of instances analysis | Excluding patients with outcome prior to the time window. Excluding patients with zero outcomes. Counts are grouped by visit |
| Cohort | Patients in cohort | Patients with outcome | Risk |
|---|---|---|---|
| Risk analysis excluding patients with outcome prior to the time window. BB: beta-blocker; CCB: calcium channel blocker; CI: confidence interval. | |||
| 1 | 362,933 | 1,043 | 0.003 |
| 2 | 362,425 | 1,420 | 0.004 |
| Risk analysis | 95% CI | ||
| Risk difference | -0.001 | (-0.001 to -0.001) | |
| Risk ratio | 0.733 | (0.677 - 0.794) | |
| Odds ratio | 0.733 | (0.676 - 0.794) | |
| Hazard ratio | 0.776 | (0.716 - 0.840) | |
| Cohort | Patients in cohort | Patients with outcome | Median survival (days) | Survival probability at end of time window |
|---|---|---|---|---|
| Kaplan-Meier survival analysis excluding patients with outcome prior to the time window. BB: beta-blocker; CCB: calcium channel blocker; CI: confidence interval. | ||||
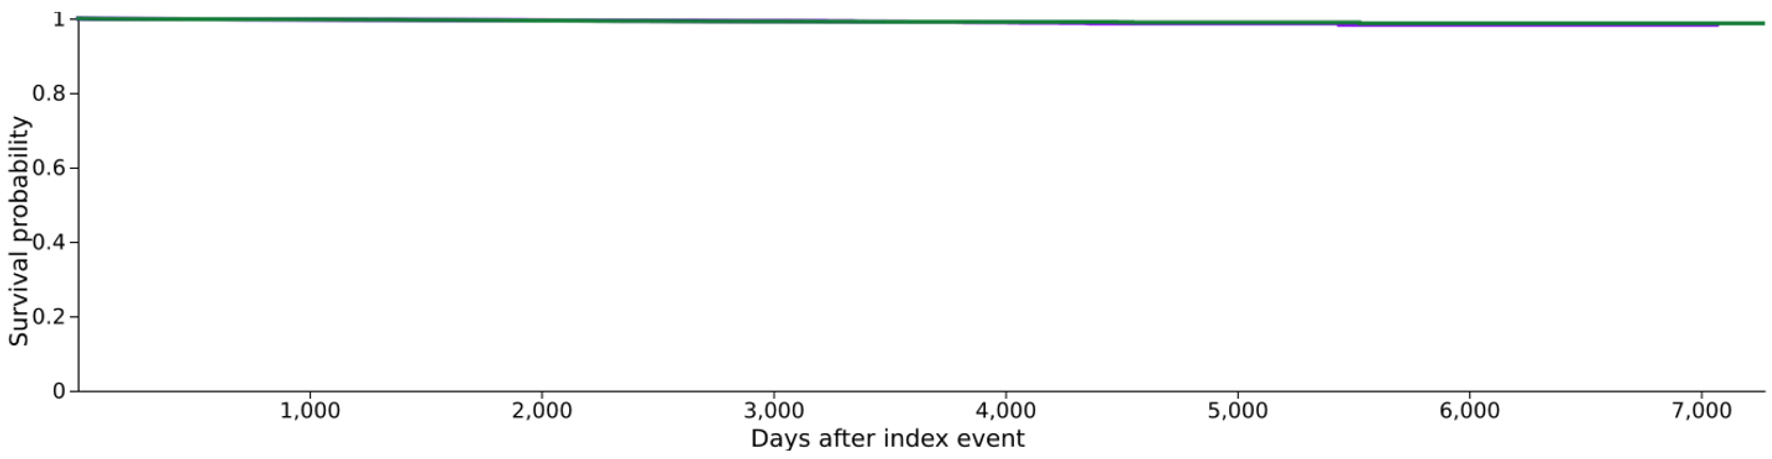
| 1 | 362,933 | 1,043 | - | 96.86% |
| 2 | 362,425 | 1,420 | - | 98.27% |
| Demographics | Mean ± SD | Patients | % of cohort | P-value | Std diff. |
|---|---|---|---|---|---|
| SD: standard deviation. | |||||
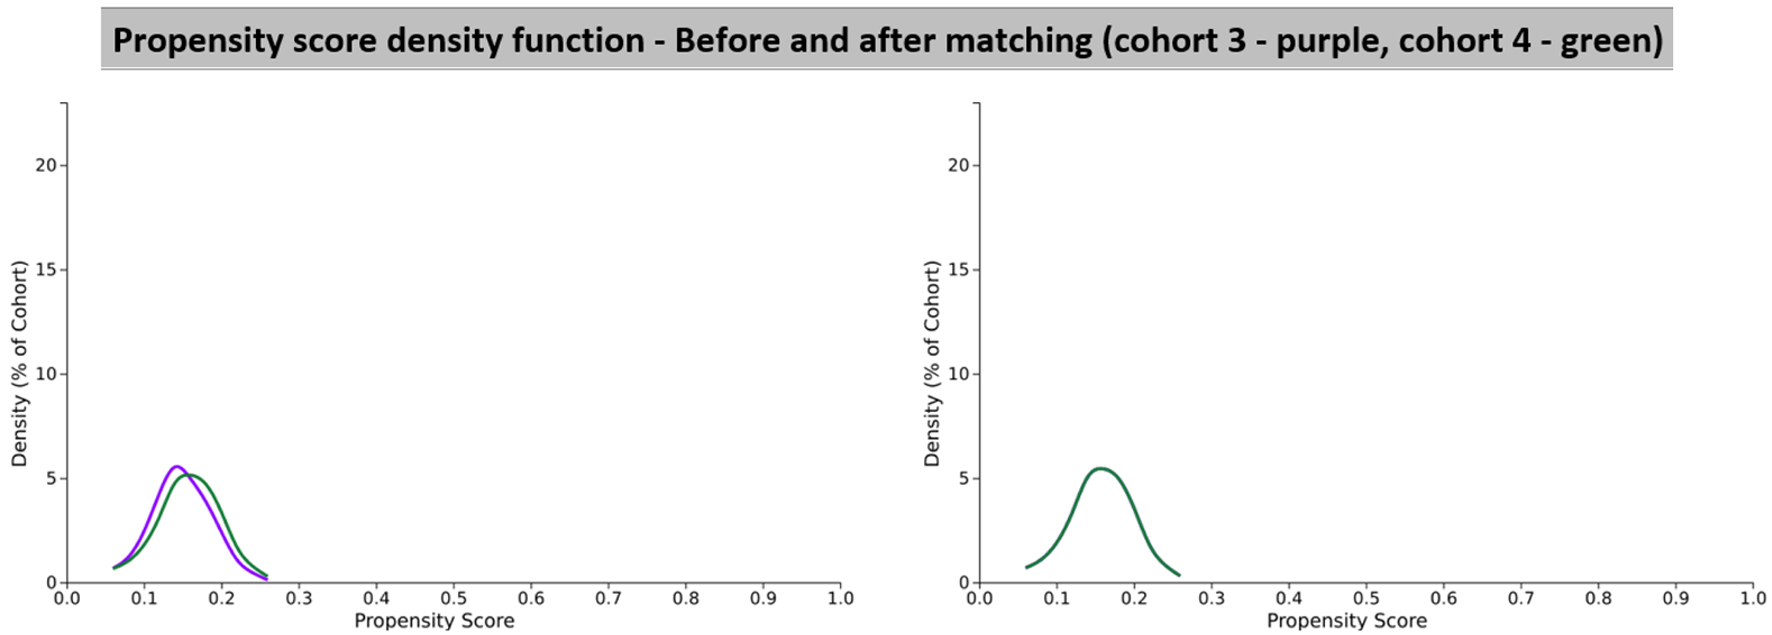
| Cohort 3 (N = 323,884) and cohort 4 (N = 63,745) before propensity score matching | |||||
| Age at index | < 0.001 | 0.241 | |||
| Cohort 3 | 59.1 ± 16.4 | 310,581 | 100% | ||
| Cohort 4 | 63.0 ± 16.5 | 60,212 | 100% | ||
| Female | < 0.001 | 0.091 | |||
| Cohort 3 | 157,695 | 50.8% | |||
| Cohort 4 | 33,296 | 55.3% | |||
| Male | < 0.001 | 0.103 | |||
| Cohort 3 | 145,692 | 46.9% | |||
| Cohort 4 | 25,182 | 41.8% | |||
| Cohort 3 (N = 60,212) and cohort 4 (N = 60,212) after propensity score matching | |||||
| Age at Index | 0.994 | < 0.001 | |||
| Cohort 3 | 63.0 ± 16.5 | 60,212 | 100% | ||
| Cohort 4 | 63.0 ± 16.5 | 60,212 | 100% | ||
| Female | 1 | < 0.001 | |||
| Cohort 3 | 33,296 | 55.3% | |||
| Cohort 4 | 33,296 | 55.3% | |||
| Male | 0.991 | < 0.001 | |||
| Cohort 3 | 25,184 | 41.8% | |||
| Cohort 4 | 25,182 | 41.8% | |||
| Cohort | Patients in cohort | Patients with outcome | Risk |
|---|---|---|---|
| Risk analysis excluding patients with outcome prior to the time window. CI: confidence interval. | |||
| 3 | 59,835 | 203 | 0.003 |
| 4 | 59,808 | 199 | 0.003 |
| Risk analysis | 95% CI | ||
| Risk difference | 0.00006 | (-0.001 to 0.001) | |
| Risk ratio | 1.020 | (0.839 - 1.239) | |
| Odds ratio | 1.020 | (0.838 - 1.240) | |
| Hazard ratio | 0.982 | (0.808 - 1.194) | |
| Cohort | Patients in cohort | Patients with outcome | Median survival (days) | Survival probability at end of time window |
|---|---|---|---|---|
| Kaplan-Meier survival analysis excluding patients with outcome prior to the time window. | ||||
| 3 | 59,835 | 203 | - | 98.30% |
| 4 | 59,808 | 199 | - | 98.69% |
| Demographics | Mean ± SD | Patients | % of cohort | P-value | Std diff. |
|---|---|---|---|---|---|
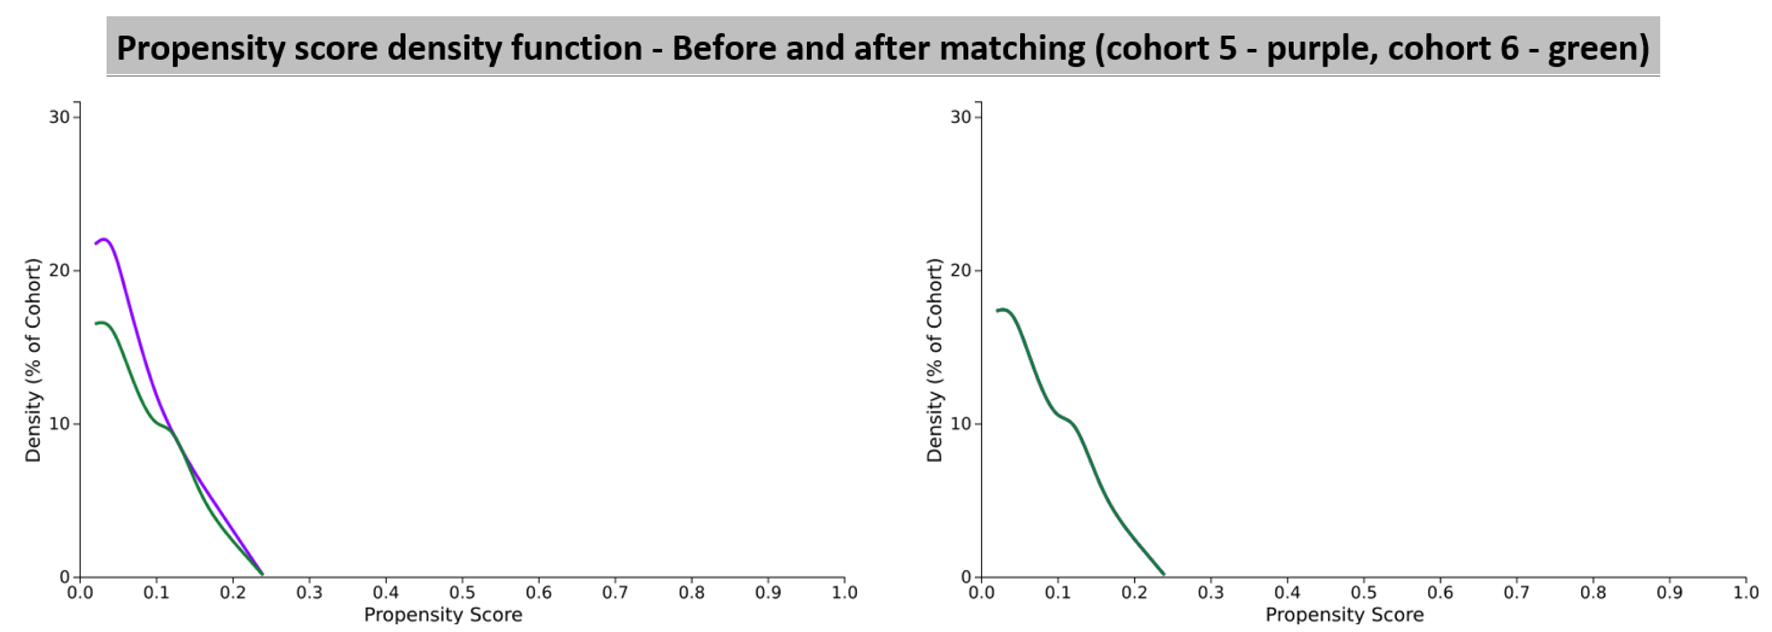
| Cohort 5 (N = 288,980) and cohort 6 (N = 19,882) before propensity score matching | |||||
| Age at index | < 0.001 | 0.338 | |||
| Cohort 5 | 59.6 ± 15.8 | 277,109 | 100% | ||
| Cohort 6 | 53.7 ± 19.1 | 18,918 | 100% | ||
| Female | < 0.001 | 0.310 | |||
| Cohort 5 | 137,633 | 49.7% | |||
| Cohort 6 | 12,259 | 64.8% | |||
| Male | < 0.001 | 0.295 | |||
| Cohort 5 | 132,714 | 47.9% | |||
| Cohort 6 | 6,347 | 33.6% | |||
| Cohort 5 (N = 18,918) and cohort 6 (N = 18,918) after propensity score matching | |||||
| Age at index | 0.999 | < 0.001 | |||
| Cohort 5 | 53.7 ± 19.1 | 18,918 | 100% | ||
| Cohort 6 | 53.7 ± 19.1 | 18,918 | 100% | ||
| Female | 1 | < 0.001 | |||
| Cohort 5 | 12,259 | 64.8% | |||
| Cohort 6 | 12,259 | 64.8% | |||
| Male | 0.991 | < 0.001 | |||
| Cohort 5 | 6,348 | 33.6% | |||
| Cohort 6 | 6,347 | 33.6% |
| Cohort | Patients in cohort | Patients with outcome | Risk |
|---|---|---|---|
| Risk analysis excluding patients with outcome prior to the time window. CI: confidence interval. | |||
| 5 | 18,831 | 36 | 0.002 |
| 6 | 18,826 | 31 | 0.002 |
| Risk analysis | 95% CI | ||
| Risk difference | 0.0003 | (-0.001 to 0.001) | |
| Risk ratio | 1.161 | (0.719 - 1.876) | |
| Odds ratio | 1.161 | (0.718 - 1.878) | |
| Hazard ratio | 1.109 | (0.686 - 1.793) | |
| Cohort | Patients in cohort | Patients with outcome | Median survival (days) | Survival probability at end of time window |
|---|---|---|---|---|
| Kaplan-Meier survival analysis excluding patients with outcome prior to the time window. | ||||
| 5 | 18,831 | 36 | - | 99.71% |
| 6 | 18,826 | 31 | - | 99.74% |