Figures
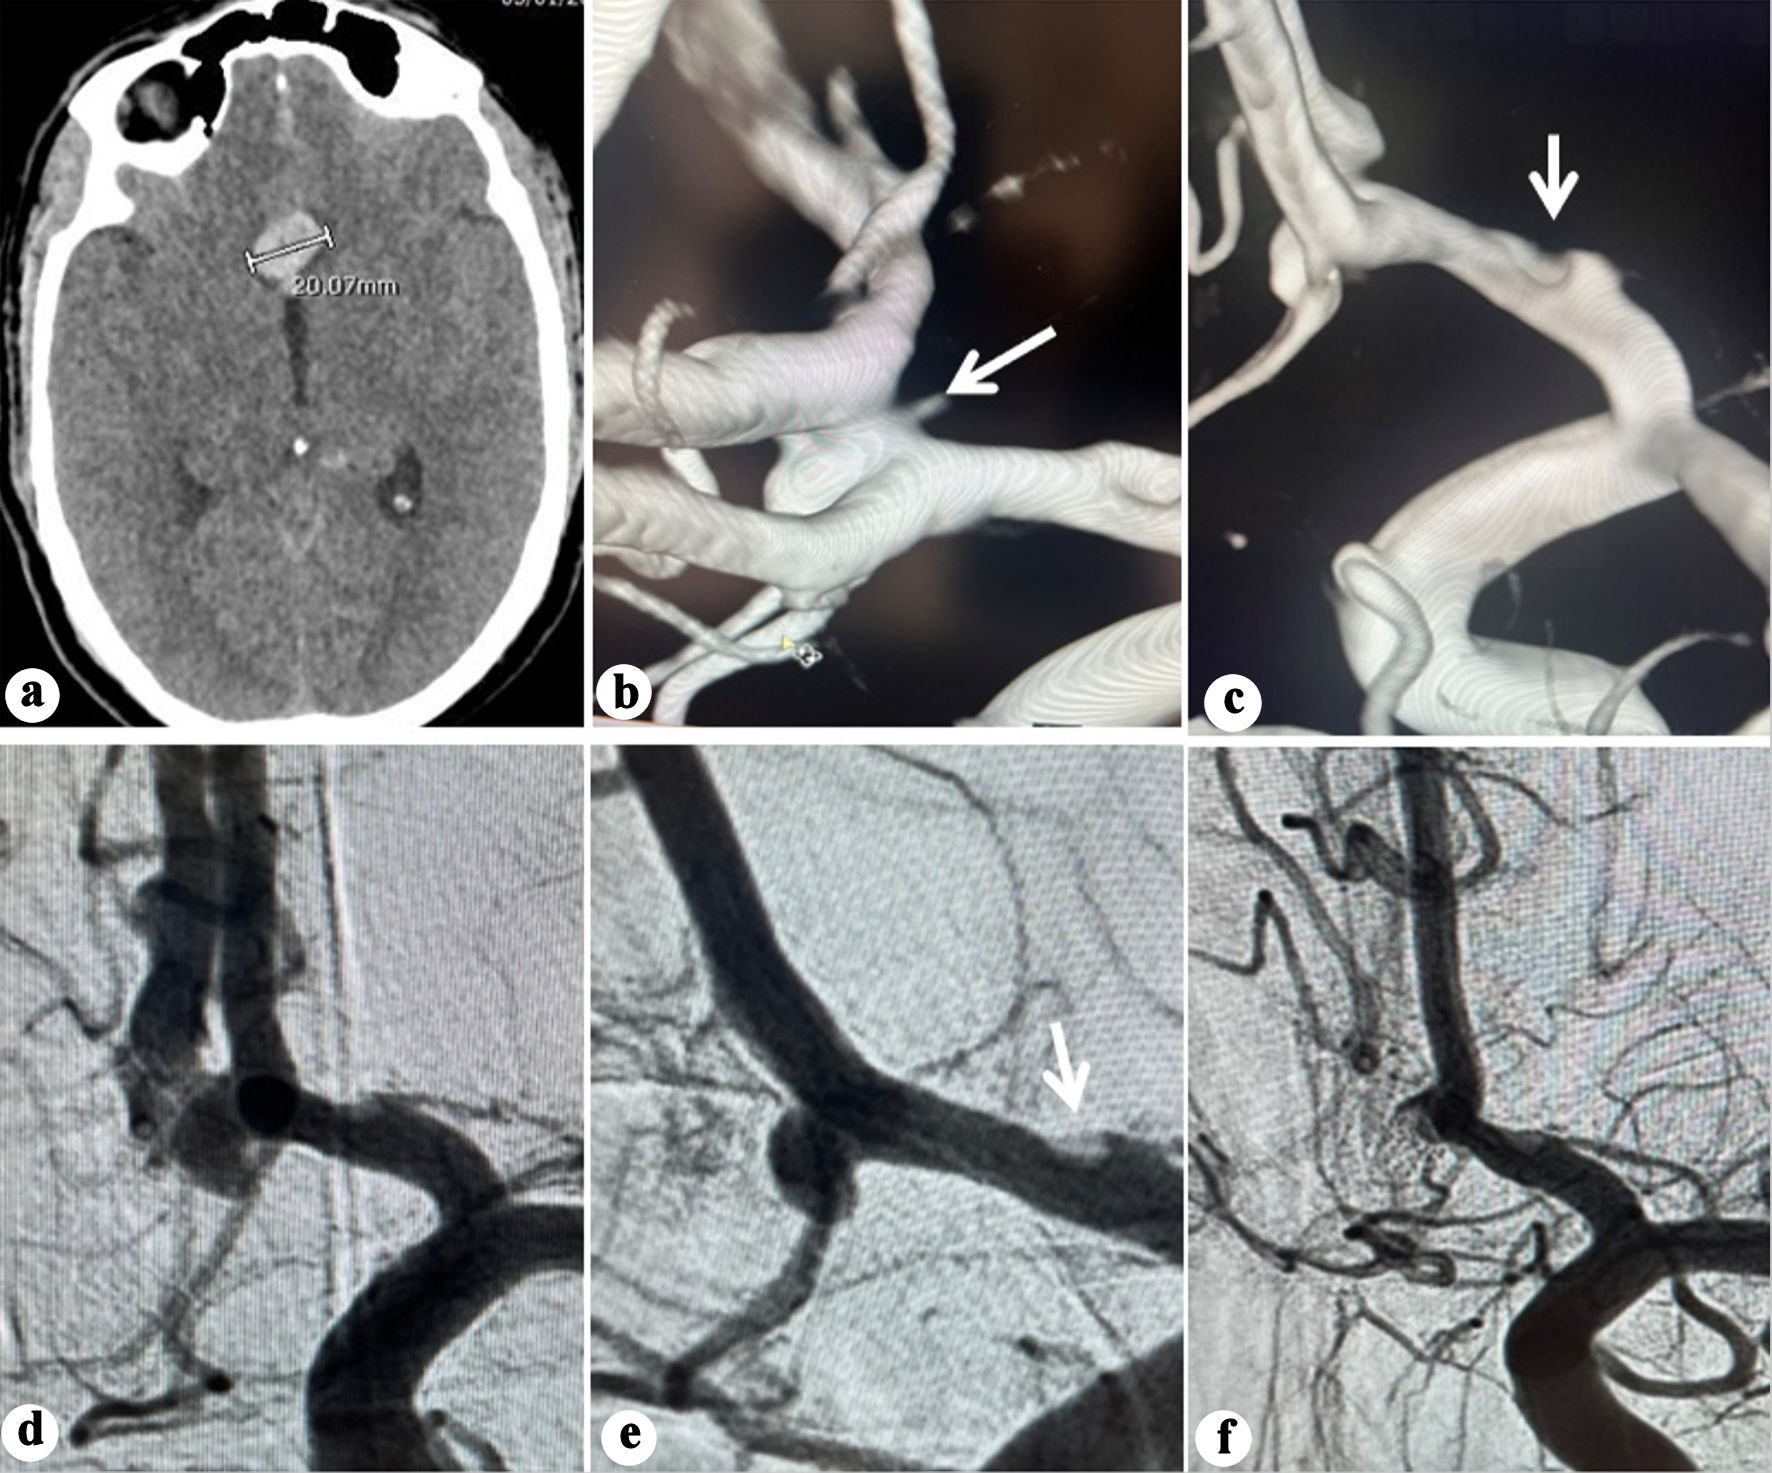
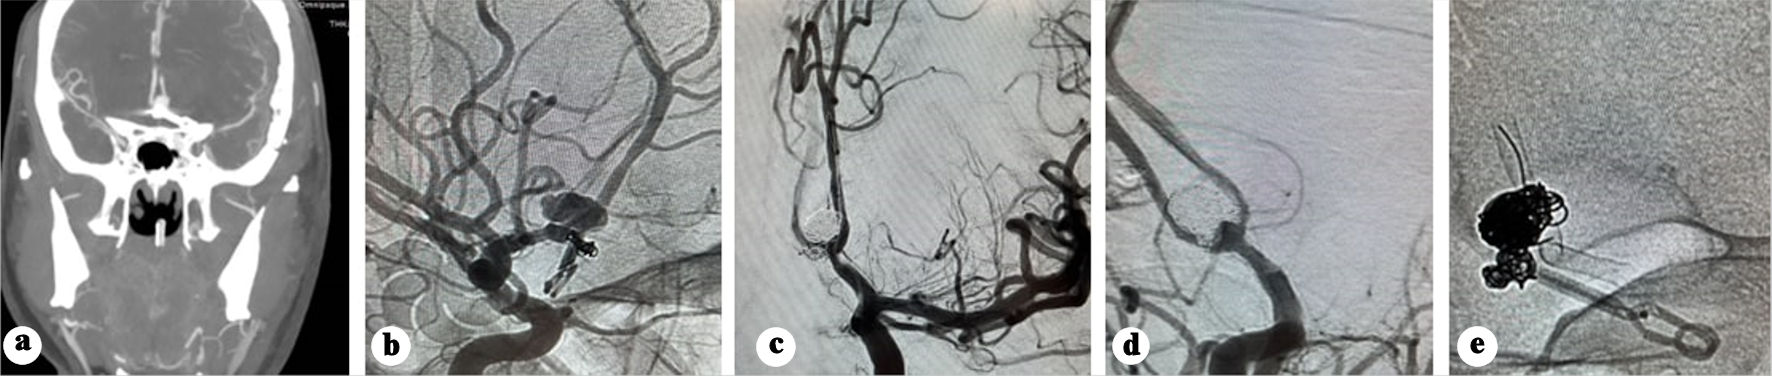
↓ Figure 1. (a) Plain CT showing interhemispheric
blood and hematoma (20.07 mm). (b) Three-dimensional (3D) reconstruction angiography showing an anterior
communicating aneurysm arising from the anteroinferior wall. Note the irregularity observed in A1
segment (arrow). (c) 3D reconstruction angiography showing no abnormality on the posterosuperior wall of
the ACoA (arrow). (d) Anteroposterior view angiography showing the ACoA aneurysm. (e) Oblique working
projection pre-coiling of the ACoA aneurysm. Note the irregularity observed in A1 segment (arrow). (f)
Oblique projection angiography post coiling of the ACoA aneurysm. ACoA: anterior communicating artery;
CT: computed tomography.
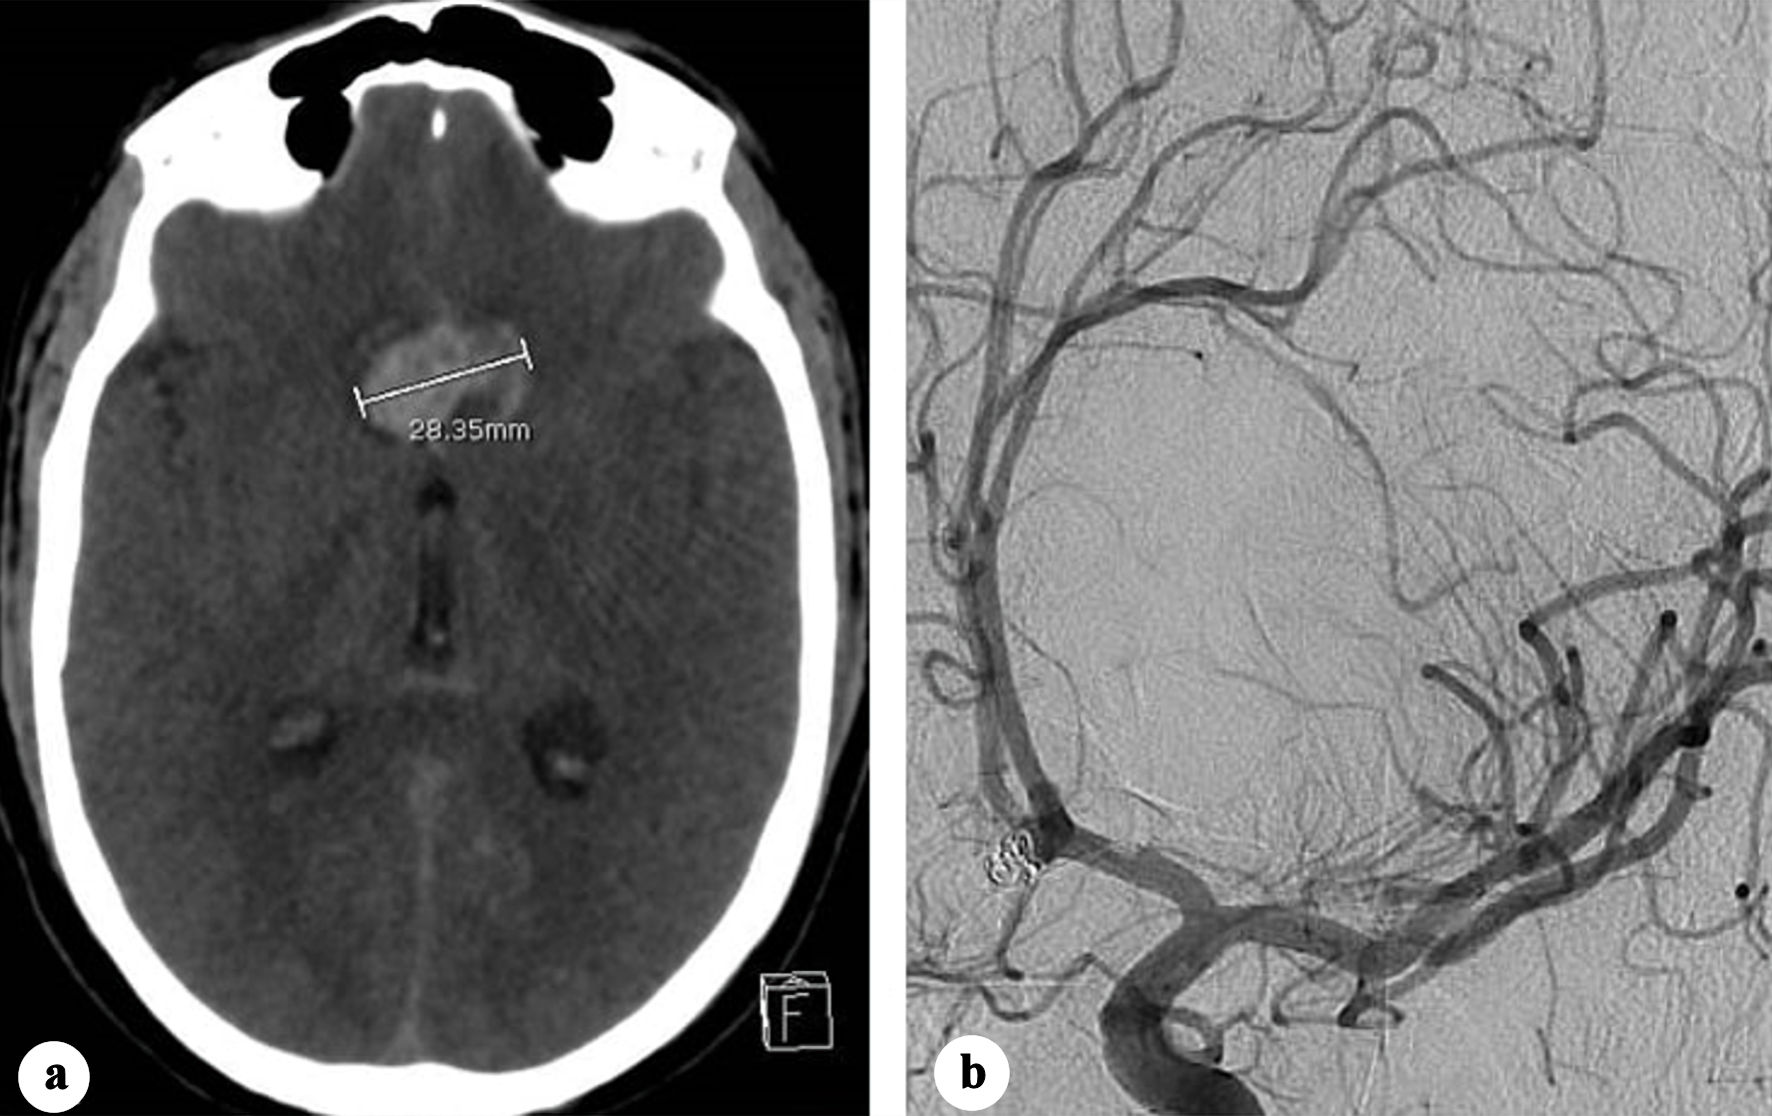
↓ Figure 2. (a) Plain CT showing increase in the
transverse diameter of the interhemispheric hematoma (28.35 mm). (b) Oblique view two-dimensional (2D)
angiography showing no change in the coiled aneurysm morphology. CT: computed tomography.
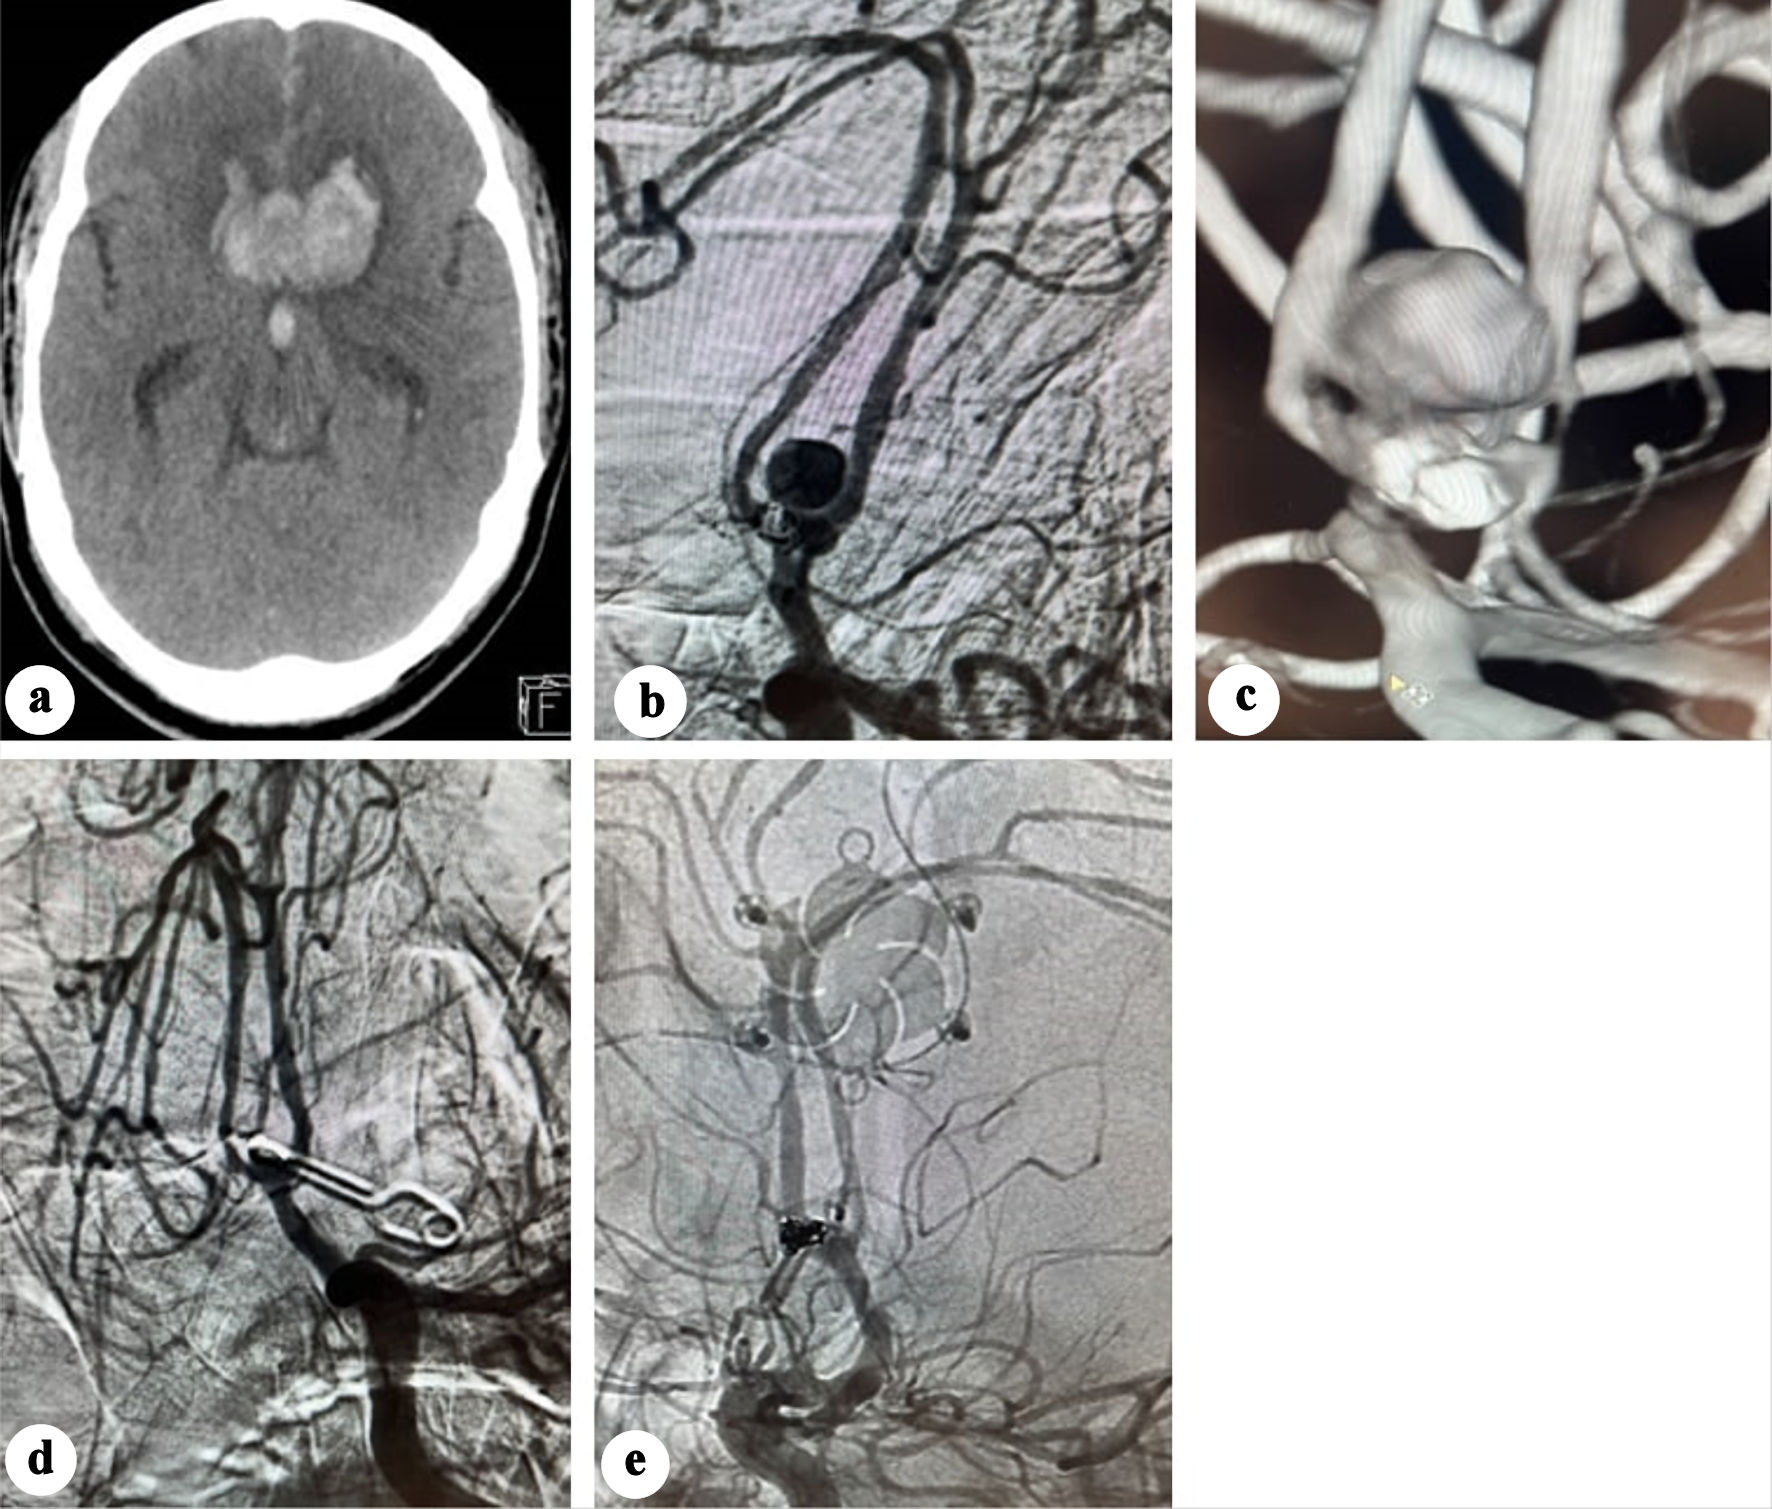
↓ Figure 3. (a) Plain CT showing significant
enlargement of the interhemispheric hematoma. (b) Anteroposterior view angiography showing developing of
a pseudoaneurysm. (c) Three-dimensional (3D) angiography showing the development of a pseudoaneurysm
opposite the previously coiled aneurysm. (d) Post-clipping subtracted angiography showing disappearance
of the pseudoaneurysm. (e) Post-clipping native subtracted angiography showing disappearance of the
pseudoaneurysm. CT: computed tomography.
↓ Figure 4. (a) CTA showing recurrence of the
pseudo sac post clipping. (b) Native angiography showing recanalization of the pseudoaneurysm. (c)
Subtracted angiography post coiling of the pseudoaneurysm. (d) Subtracted angiography showing early
recanalization of the pseudoaneurysm base. (e) Native acquisition showing the flow diverter deployed in
the left side. CT: computed tomography.
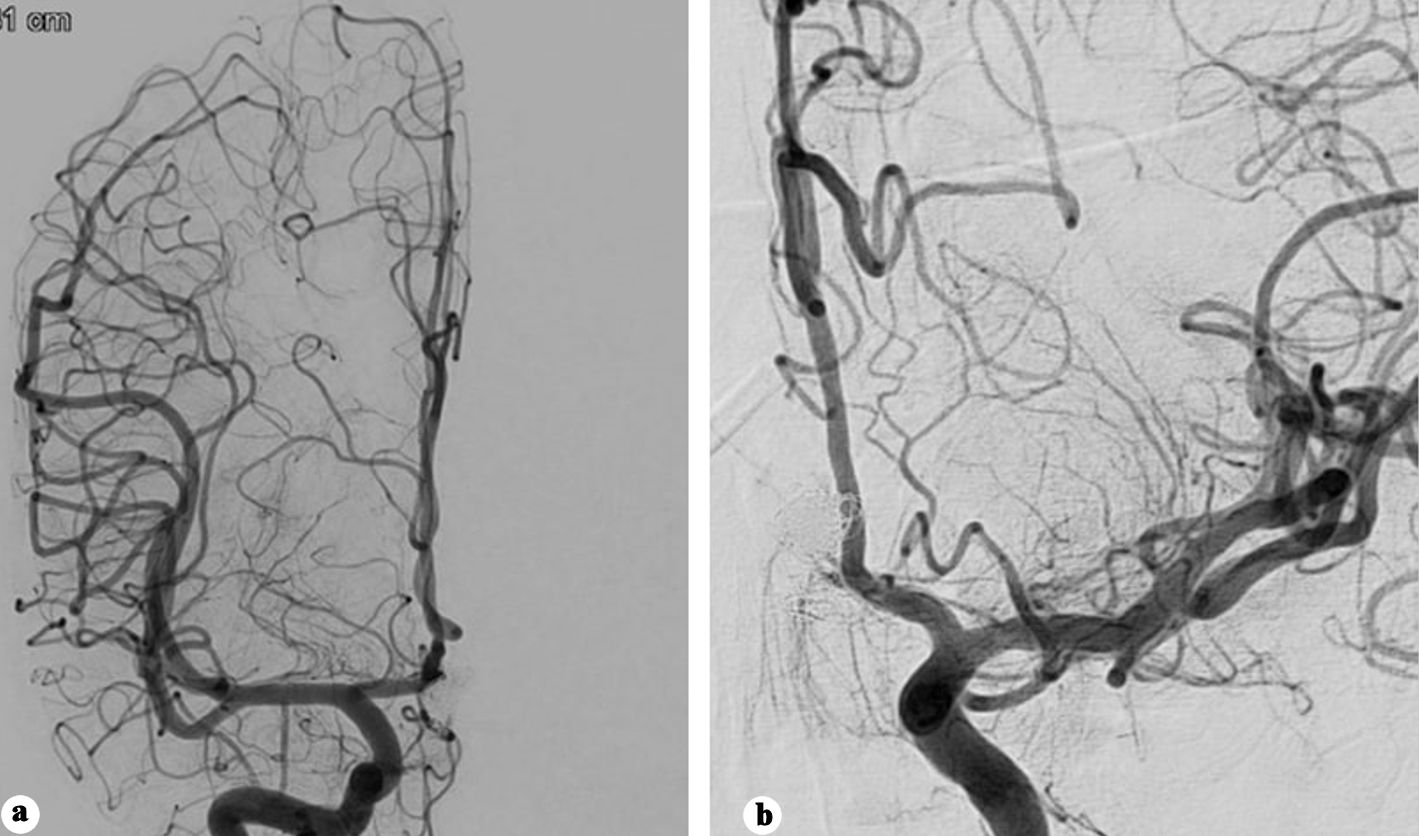
↓ Figure 5. (a) Anteroposterior view of right
internal carotid angiography showing no filling of the aneurysm. (b) Anteroposterior view of left
internal carotid angiography showing no filling of the aneurysm.
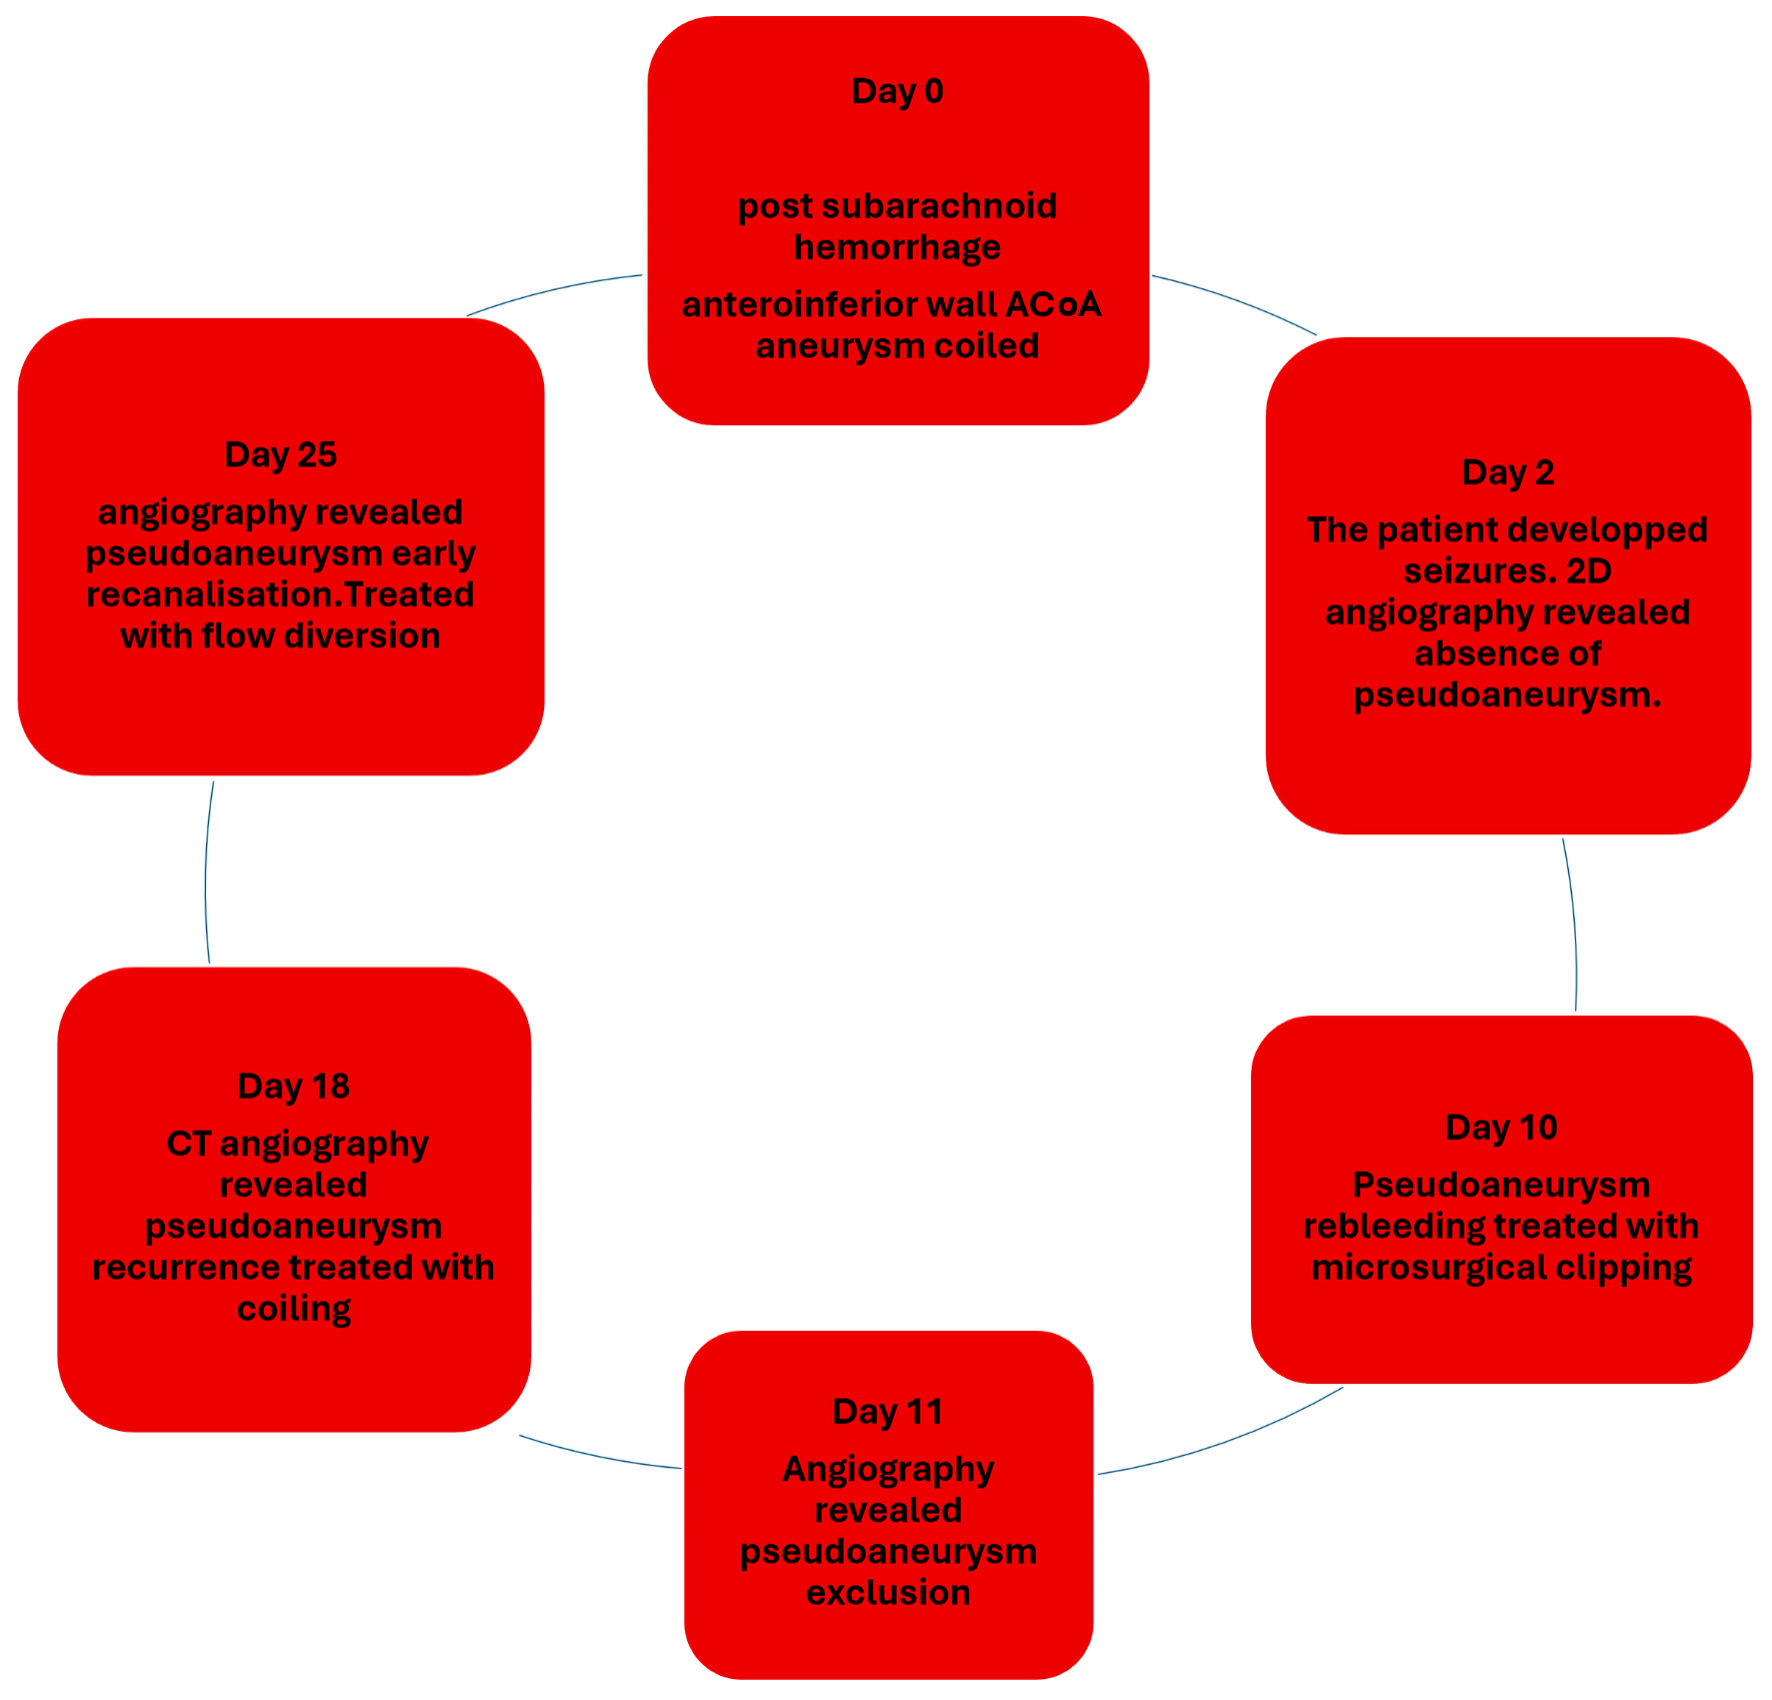
↓ Figure 6. Timeline figure summarizing the
chronological sequence of interventions and hemorrhagic events. ACoA: anterior communicating artery; CT:
computed tomography; 2D: two-dimensional.