Journal of Neurology Research, ISSN 1923-2845 print, 1923-2853 online, Open Access
Article copyright, the authors; Journal compilation copyright, J Neurol Res and Elmer Press Inc
Journal website https://jnr.elmerpub.com

Original Article

Volume 15, Number 4, December 2025, pages 172-181


Mortality Following Intracerebral Hemorrhage After Intravenous Alteplase in Acute Ischemic Stroke: A Decision Tree-Based Classification Approach

Figures

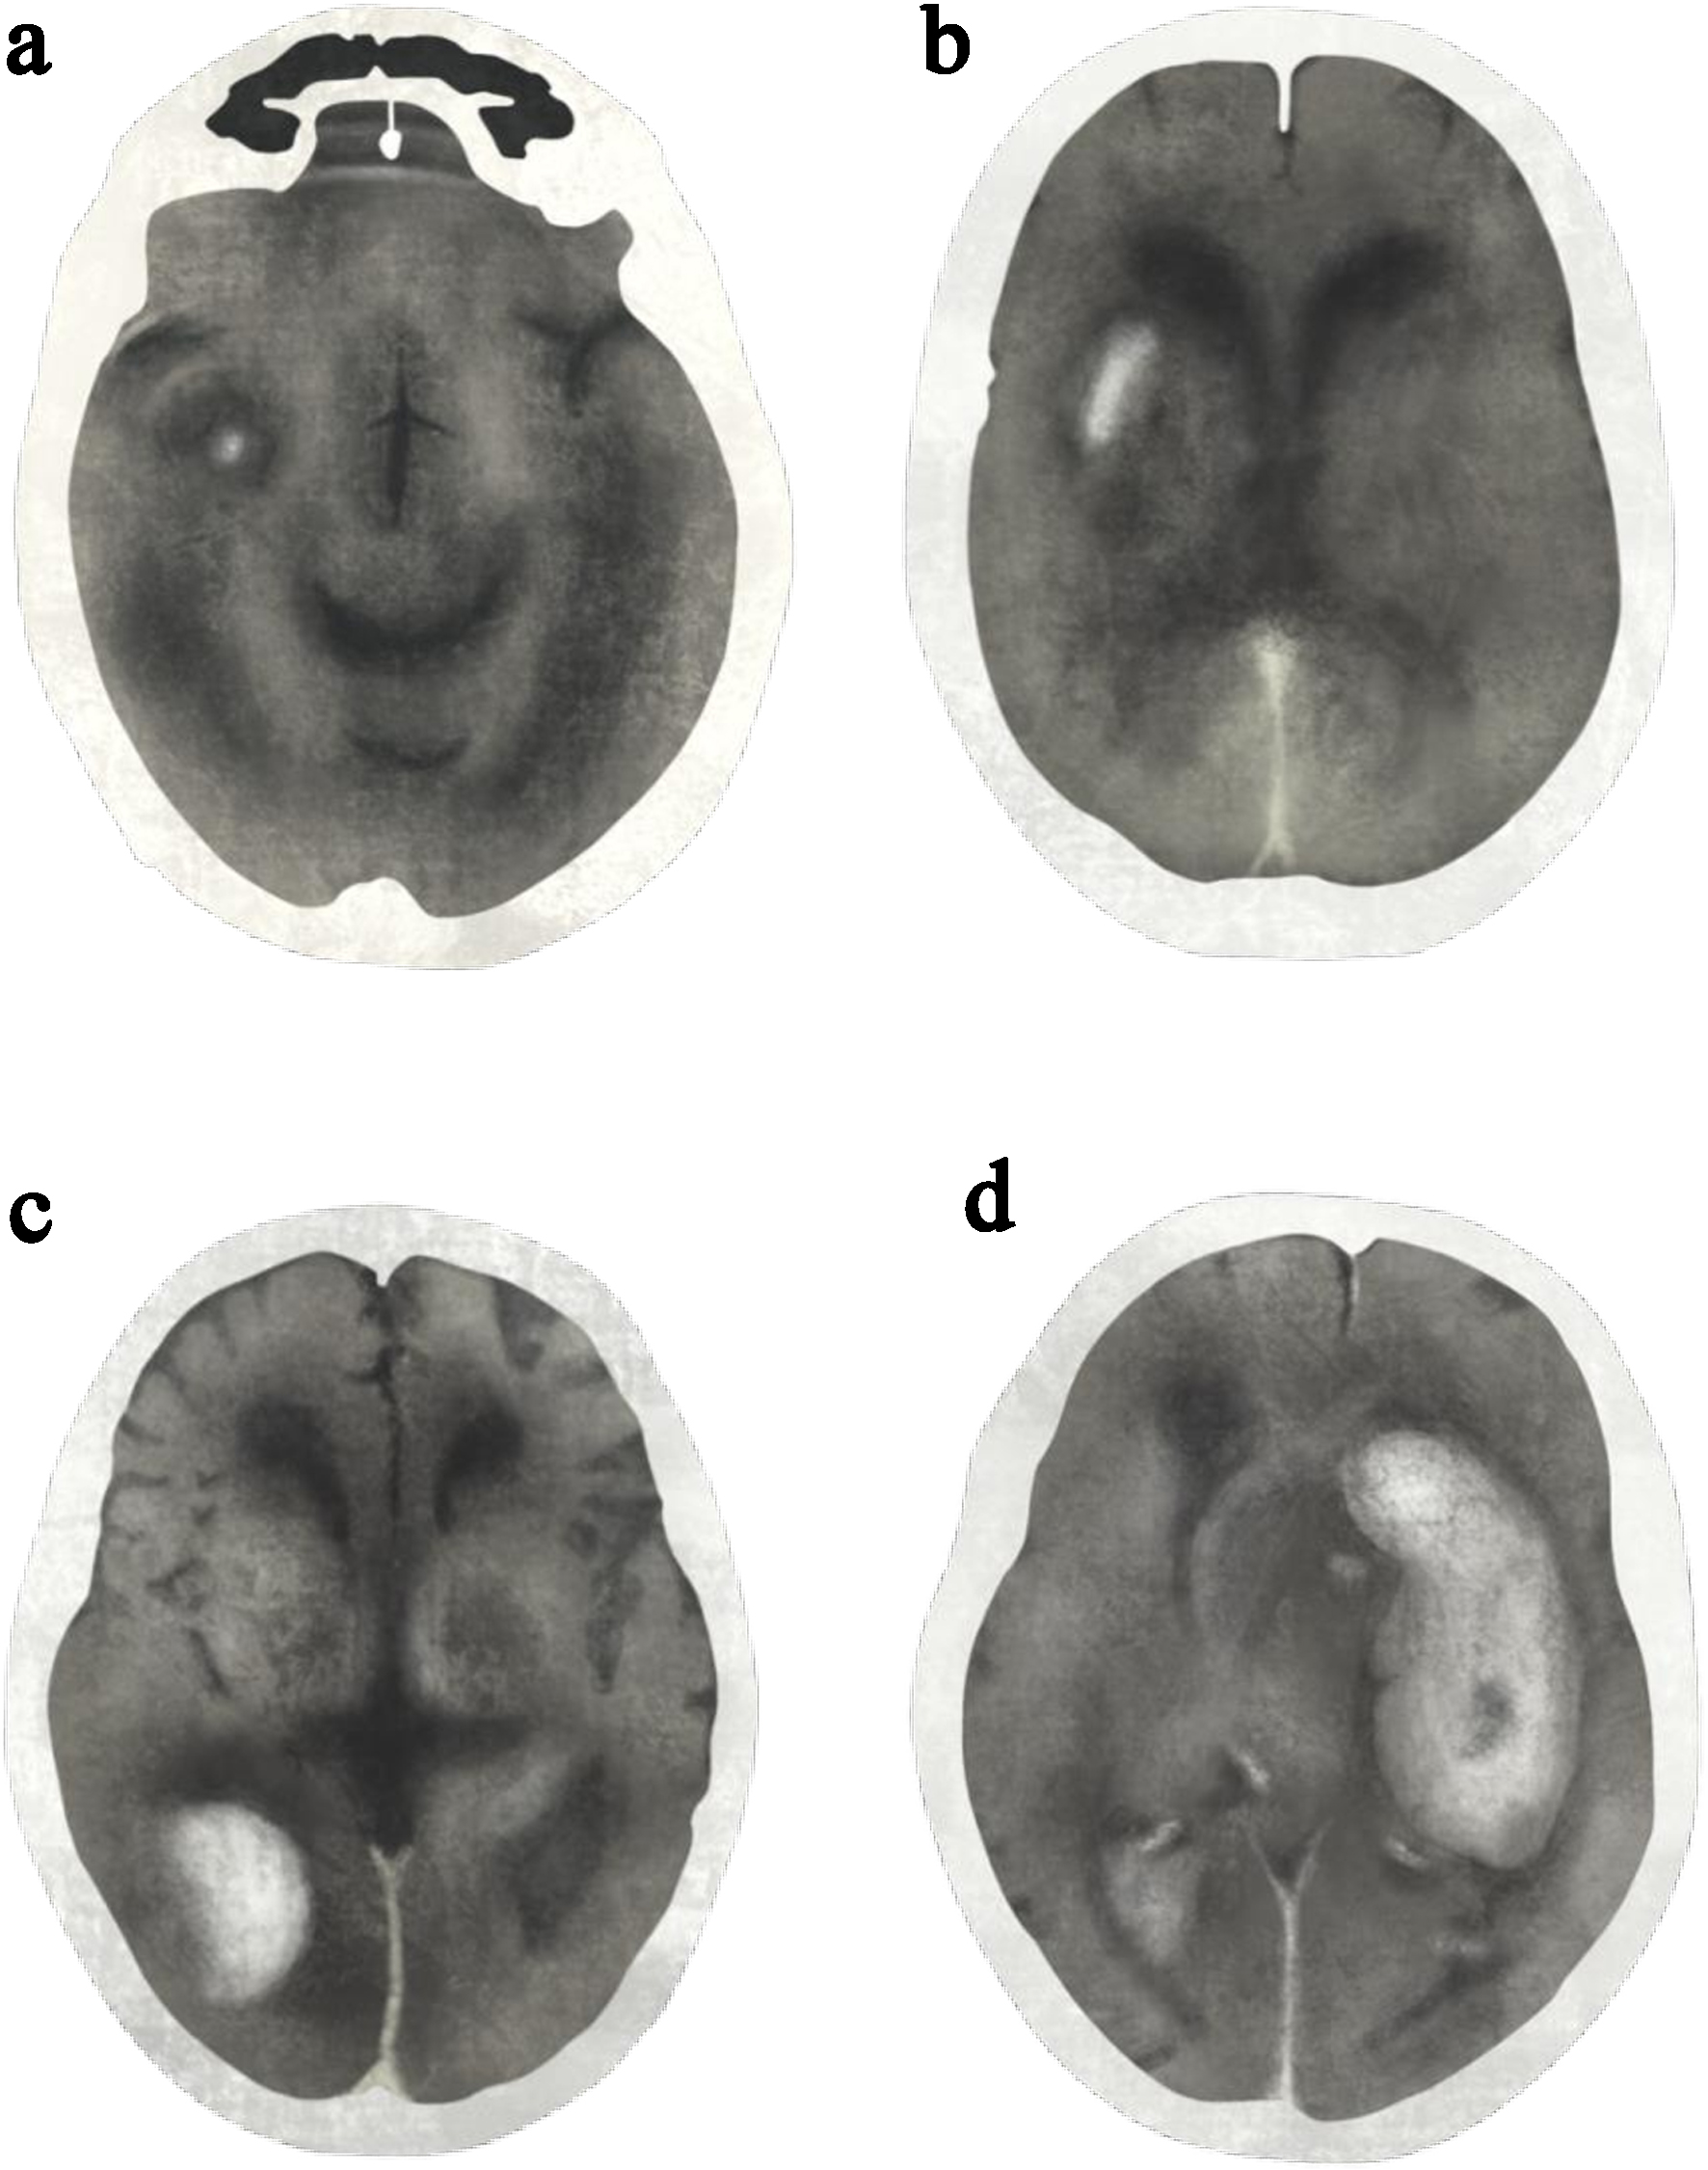
↓  Figure 1. Post-alteplase intracerebral hemorrhage classified by radiographic classifications: (a) hemorrhagic infarction type 1 (HI1), (b) hemorrhagic infarction type 2 (HI2), (c) parenchymal hematoma type 1 (PH1), and (d) parenchymal hematoma type 2 (PH2). Illustration drawn and modified from the original reference [16].
Figure 1.
↓  Figure 2. Study flow diagram. asICH: asymptomatic intracerebral hemorrhage; HI: hemorrhagic infarction; ICH: intracerebral hemorrhage; PH: parenchymal hematoma; sICH: symptomatic intracerebral hemorrhage; TOAST: Trial of Org 10172 in Acute Stroke Treatment.
Figure 2.
↓  Figure 3. Decision tree diagram. ECASS II: European Cooperative Acute Stroke Study II; HI: hemorrhagic infarction; PH: parenchymal hematoma; Sx: surgery.
Figure 3.

Tables

↓  Table 1. Baseline Characteristics of Patients With Post-Alteplase Intracerebral Hemorrhage Stratified by Survival Status
 
Baseline characteristics Dead (n = 25), n (%) Survived (n = 69), n (%) P value
IQR: interquartile range; NIHSS: National Institutes of Health Stroke Scale; SD: standard deviation.
Male 12 (48.0) 34 (49.3) 0.376
Age (years), mean ± SD 72.1 ± 8.9 64.9 ± 11.1 0.003
NIHSS, median (IQR) 14 (11, 20) 12 (8, 16) 0.022


↓  Table 2. Radiographic Classifications of Post-Alteplase Intracerebral Hemorrhage Stratified by Survival Status
 
Radiographic classifications Dead (n = 25), n (%) Survived (n = 69), n (%) P value
HI: hemorrhagic infarction; PH: parenchymal hematoma.
HI1 0 (0) 10 (14.5) 0.044
HI2 1 (4.0) 27 (39.1) 0.001
PH1 7 (28.0) 19 (27.5) 0.962
PH2 17 (68.0) 13 (18.9) < 0.001


↓  Table 3. Clinical Classifications of Post-Alteplase Intracerebral Hemorrhage Stratified by Survival Status
 
Clinical classifications Dead, n (%) Survived, n (%) P value
asICH: asymptomatic intracerebral hemorrhage; ECASS II: European Cooperative Acute Stroke Study II; mSITS-MOST: modified Safe Implementation of Thrombolysis in Stroke-Monitoring Study; NINDS: National Institute of Neurological Disorders and Stroke; sICH: symptomatic intracerebral hemorrhage.
NINDS
  asICH 0 (0) 43 (100) 0.886
  sICH 25 (49.0) 26 (51.0)
ECASS II
  asICH 0 (0) 44 (100) 1.000
  sICH 25 (50.0) 25 (50.0)
mSITS-MOST
  asICH 1 (2.2) 44 (97.8) 0.889
  sICH 24 (49.0) 25 (51.0)


↓  Table 4. Proportion of Symptomatic and Asymptomatic Intracerebral Hemorrhages Across Clinical Definitions
 
Definitions NINDS (n = 94), n (%) ECASS II (n = 94), n (%) mSITS-MOST (n = 94), n (%) P value
asICH: asymptomatic intracerebral hemorrhage; ECASS II: European Cooperative Acute Stroke Study II; mSITS-MOST: modified Safe Implementation of Thrombolysis in Stroke-Monitoring Study; NINDS: National Institute of Neurological Disorders and Stroke; sICH: symptomatic intracerebral hemorrhage.
asICH 43 (45.7) 44 (46.8) 45 (47.9) 0.958
sICH 51 (54.3) 50 (53.2) 49 (52.1)


↓  Table 5. Surrogates’ Decisions and 7-Day Mortality According to Neurosurgeon’s Suggestion
 
Surrogates’ decisions Neurosurgeon’s suggestion
Conservative management (n = 10), dead/total (%) Neurosurgical intervention (n = 20), dead/total (%)
In each cell, the numerator indicates the number of deaths and the denominator indicates the total number of patients within that stratum, with the percentage shown in parentheses. NA: not applicable.
Complied 6/10 (60.0%) 7/16 (43.8%)
Refused 0/0 (NA) 4/4 (100%)
- P = 0.043


↓  Table 6. Comparison of NIHSS Categories Across Radiographic Classifications Between Lampang and Saraburi Cohorts
 
NIHSS HI1, n (%) HI2, n (%) PH1, n (%) PH2, n (%)
HI: hemorrhagic infarction; NIHSS: National Institutes of Health Stroke Scale; PH: parenchymal hematoma.
Lampang cohort (n = 94) n = 10 n = 28 n = 26 n = 30
  4 - 15 10 (100) 20 (71.4) 13 (50.0) 17 (56.7)
  16 - 20 0 (0) 5 (17.9) 10 (38.5) 7 (23.3)
  > 20 0 (0) 3 (10.7) 3 (11.5) 6 (20.0)
Saraburi cohort (n = 81) [21] HI1 + HI2 (n = 38) n = 17 n = 26
  4 - 15 23 (60.5) 9 (52.9) 5 (19.2)
  16 - 20 10 (26.3) 5 (29.4) 15 (57.7)
  > 20 5 (13.2) 3 (17.7) 6 (23.1)