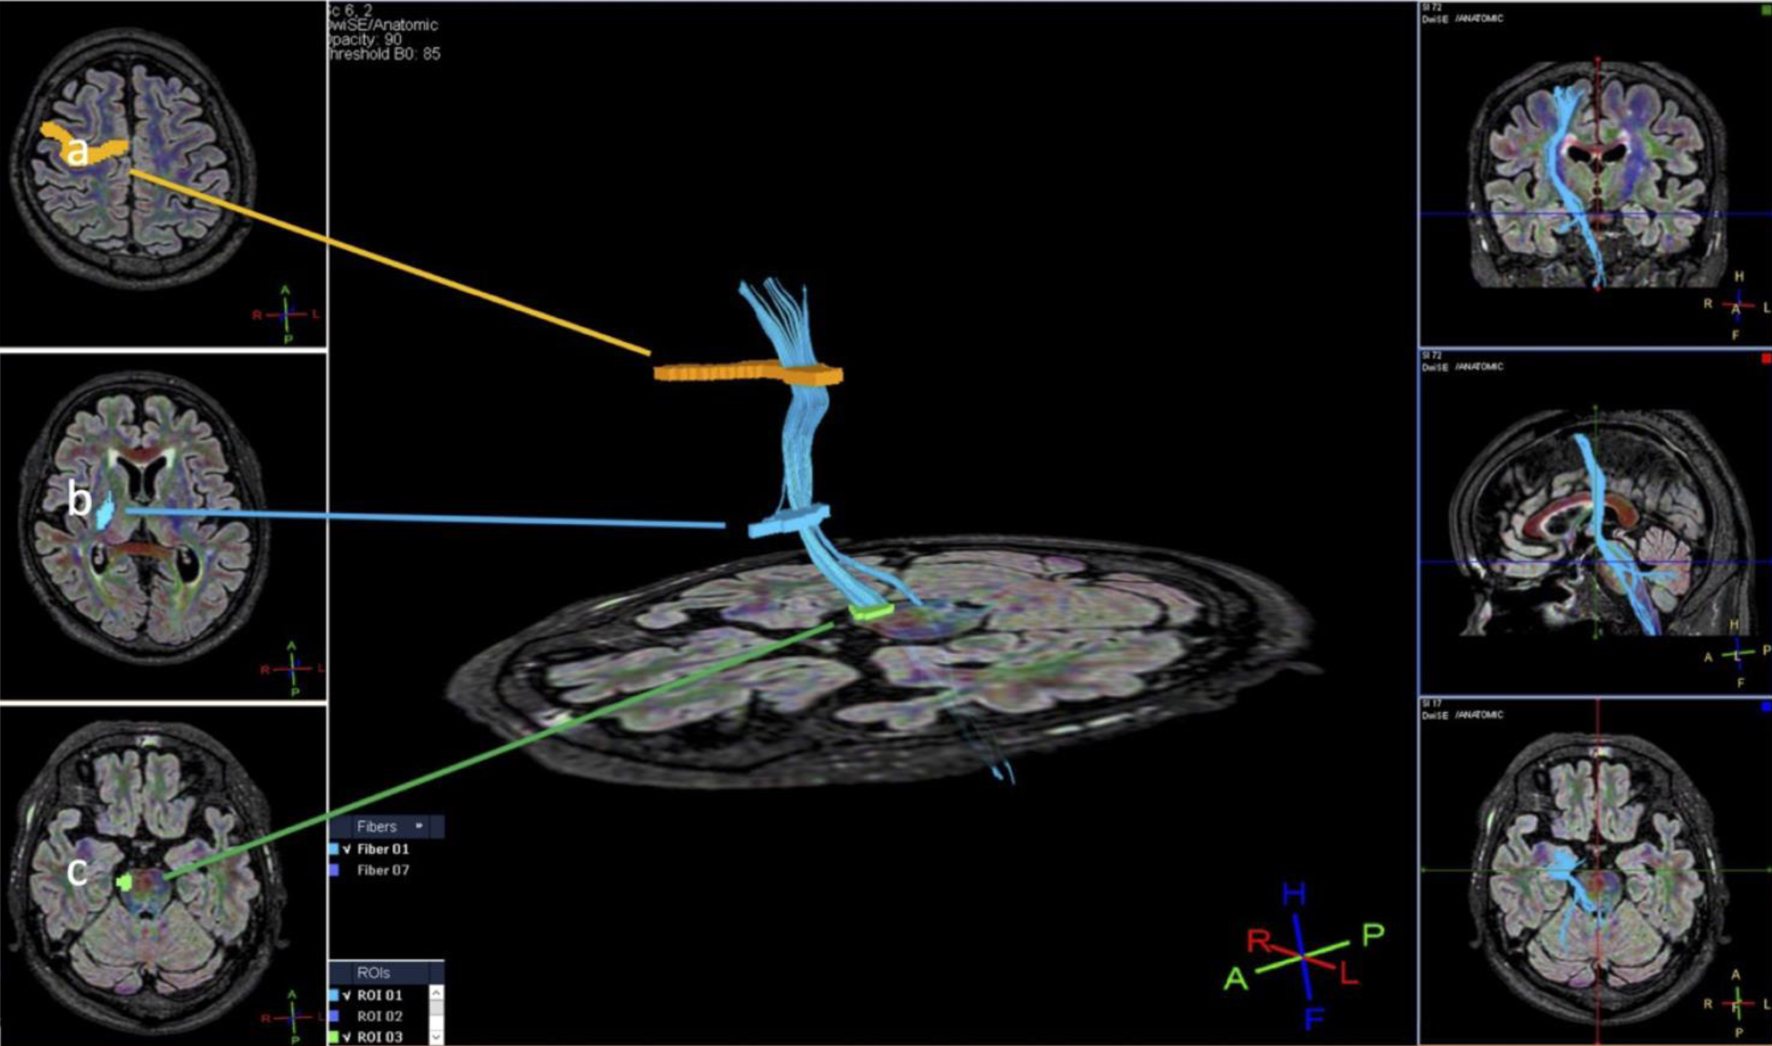
↓ Figure 1. Method for setting the region of interest (ROI): (a) precentral gyrus; (b) posterior limb of the internal capsule; (c) cerebral peduncle.
| Journal of Neurology Research, ISSN 1923-2845 print, 1923-2853 online, Open Access |
| Article copyright, the authors; Journal compilation copyright, J Neurol Res and Elmer Press Inc |
| Journal website https://jnr.elmerpub.com |
Original Article
Volume 16, Number 2, June 2026, pages 77-87
Comparison of Diffusion Tensor Imaging Parameters Associated With Motor Fiber Injury Between Patients With Chronic Subdural Hematoma and Intracerebral Hemorrhage
Figures
Tables
| Patient | Pre-surgery | Post-surgery | ||||||
|---|---|---|---|---|---|---|---|---|
| FA | ADC | FA | ADC | |||||
| Lesion | Normal | Lesion | Normal | Lesion | Normal | Lesion | Normal | |
| ADC: apparent diffusion coefficient; CSDH: chronic subdural hematoma; FA: fractional anisotropy. | ||||||||
| 1 | 0.542 | 0.524 | 0.664 | 0.736 | 0.564 | 0.548 | 0.657 | 0.713 |
| 2 | 0.631 | 0.608 | 0.68 | 0.687 | 0.513 | 0.524 | 0.722 | 0.701 |
| 3 | 0.552 | 0.524 | 0.68 | 0.712 | 0.546 | 0.524 | 0.729 | 0.768 |
| 4 | 0.534 | 0.517 | 0.74 | 0.727 | 0.522 | 0.517 | 0.74 | 0.727 |
| 5 | 0.49 | 0.513 | 0.661 | 0.757 | 0.524 | 0.523 | 0.684 | 0.769 |
| 6 | 0.566 | 0.544 | 0.709 | 0.724 | 0.594 | 0.54 | 0.646 | 0.713 |
| 7 | 0.57 | 0.552 | 0.664 | 0.721 | 0.519 | 0.541 | 0.69 | 0.682 |
| 8 | 0.519 | 0.579 | 0.728 | 0.722 | 0.571 | 0.579 | 0.735 | 0.74 |
| 9 | 0.539 | 0.52 | 0.741 | 0.725 | 0.512 | 0.51 | 0.784 | 0.871 |
| 10 | 0.493 | 0.504 | 0.687 | 0.703 | 0.54 | 0.524 | 0.709 | 0.744 |
| 11 | 0.543 | 0.532 | 0.626 | 0.685 | 0.529 | 0.529 | 0.697 | 0.68 |
| 12 | 0.6 | 0.562 | 0.733 | 0.718 | ||||
| 13 | 0.524 | 0.515 | 0.689 | 0.741 | ||||
| 14 | 0.597 | 0.565 | 0.65 | 0.654 | ||||
| 15 | 0.604 | 0.496 | 0.704 | 0.884 | ||||
| 16 | 0.585 | 0.565 | 0.658 | 0.676 | ||||
| 17 | 0.483 | 0.48 | 0.775 | 0.81 | ||||
| 18 | 0.562 | 0.547 | 0.728 | 0.72 | ||||
| 19 | 0.495 | 0.533 | 0.656 | 0.736 | ||||
| 20 | 0.556 | 0.557 | 0.739 | 0.762 | ||||
| 21 | 0.65 | 0.642 | 1.04 | 0.974 | ||||
| 22 | 0.552 | 0.514 | 0.731 | 0.701 | ||||
| 23 | 0.616 | 0.603 | 0.672 | 0.645 | ||||
| 24 | 0.546 | 0.575 | 0.638 | 0.656 | ||||
| 25 | 0.448 | 0.5 | 0.784 | 0.809 | ||||
| 26 | 0.554 | 0.564 | 0.674 | 0.664 | ||||
| 27 | 0.573 | 0.567 | 0.642 | 0.701 | ||||
| 28 | 0.524 | 0.532 | 0.842 | 0.789 | ||||
| 29 | 0.558 | 0.58 | 0.666 | 0.689 | ||||
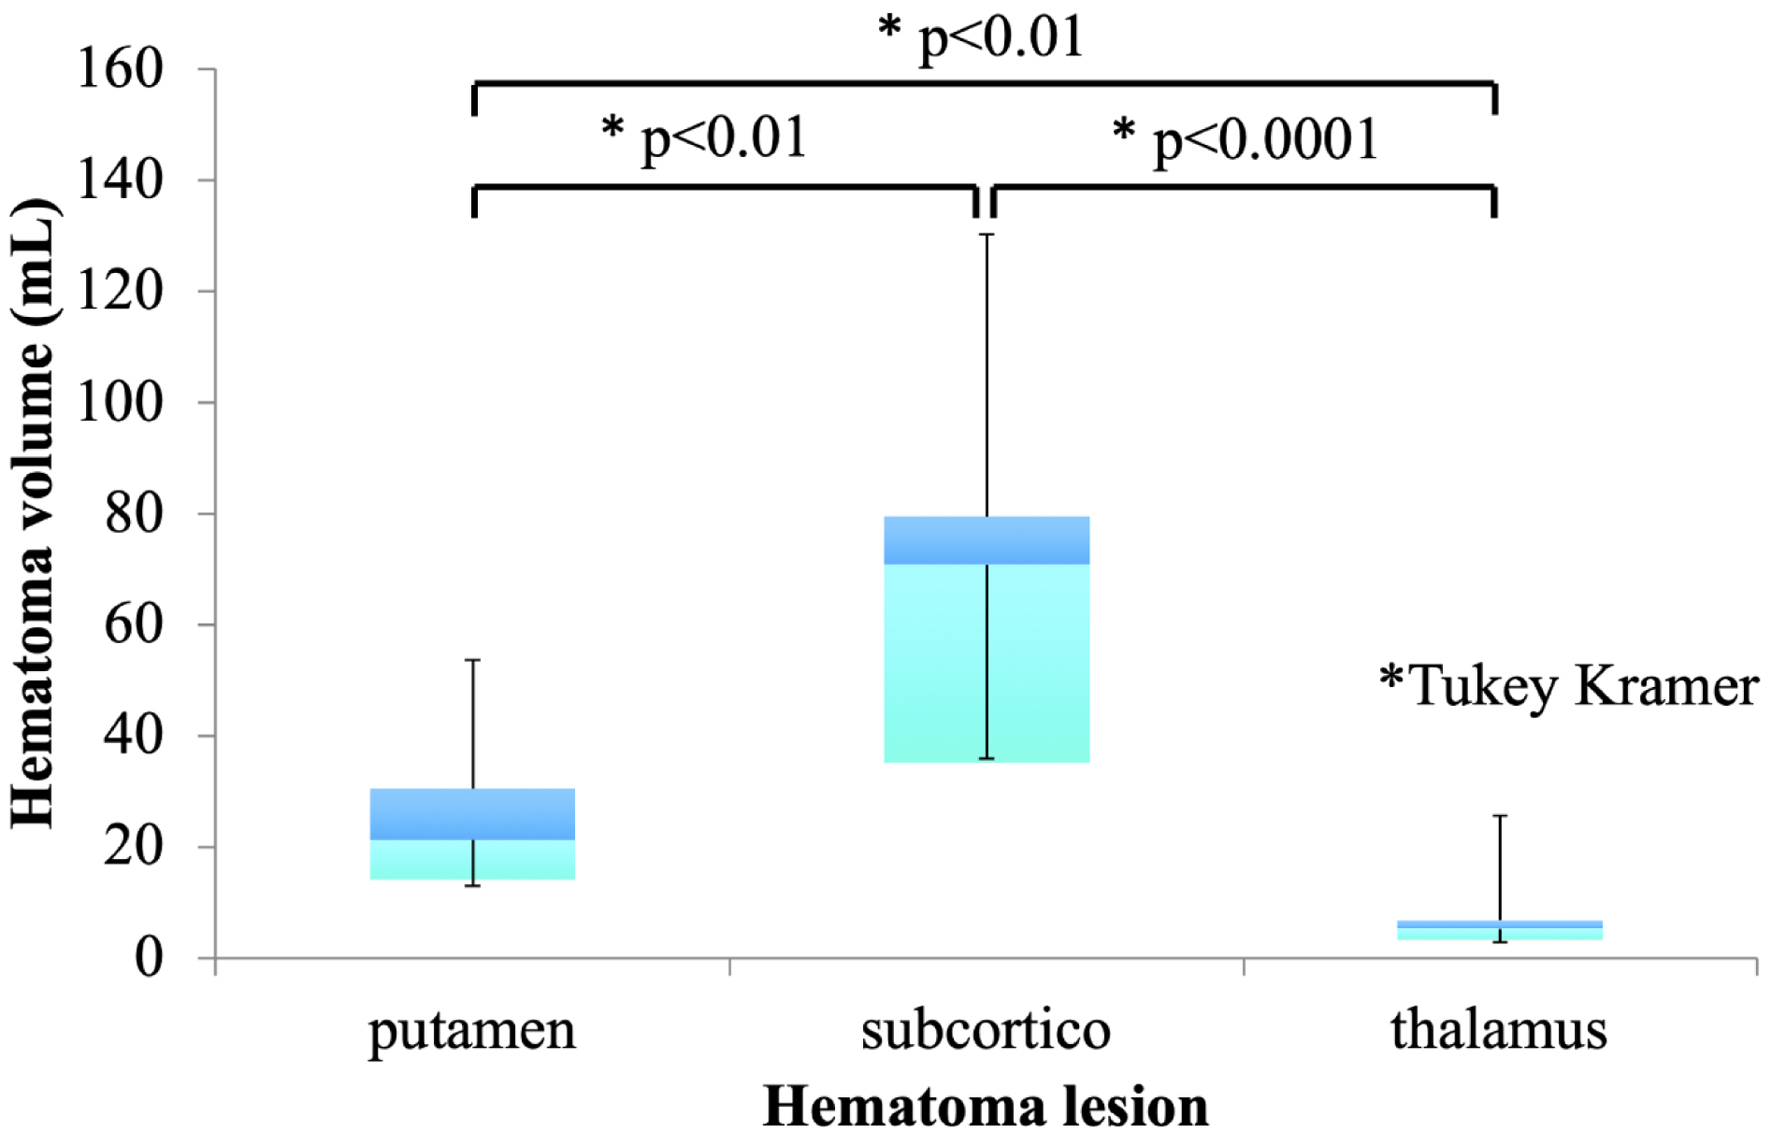
| Patient | Putamen (n = 13) | Subcortical (n = 11) | Thalamus (n = 13) | |||||||||
|---|---|---|---|---|---|---|---|---|---|---|---|---|
| FA | ADC | FA | ADC | FA | ADC | |||||||
| Lesion | Normal | Lesion | Normal | Lesion | Normal | Lesion | Normal | Lesion | Normal | Lesion | Normal | |
| Putamen (mean 69.5 ± 12.1 years; eight men and five women), subcortical (mean 71.2 ± 12.3 years; five men and six women), thalamus (mean 75.2 ± 15.4 years; five men and eight women). Each lesion location represents a distinct patient. No patient had multiple hemorrhage locations. ADC: apparent diffusion coefficient; FA: fractional anisotropy; ICH: intracerebral hemorrhage. | ||||||||||||
| 1 | 0.474 | 0.543 | 0.939 | 0.799 | 0.486 | 0.501 | 0.732 | 0.713 | 0.507 | 0.524 | 0.739 | 0.712 |
| 2 | 0.515 | 0.504 | 0.818 | 0.893 | 0.543 | 0.531 | 0.733 | 0.836 | 0.5 | 0.516 | 0.693 | 0.791 |
| 3 | 0.472 | 0.494 | 0.812 | 0.858 | 0.531 | 0.516 | 0.616 | 0.746 | 0.596 | 0.534 | 0.75 | 0.768 |
| 4 | 0.491 | 0.521 | 0.843 | 0.921 | 0.531 | 0.536 | 0.744 | 0.854 | 0.523 | 0.551 | 0.794 | 0.774 |
| 5 | 0.516 | 0.554 | 0.659 | 0.681 | 0.587 | 0.53 | 0.716 | 0.729 | 0.566 | 0.625 | 0.605 | 0.591 |
| 6 | 0.543 | 0.531 | 0.733 | 0.836 | 0.54 | 0.549 | 0.661 | 0.651 | 0.503 | 0.502 | 0.695 | 0.764 |
| 7 | 0.506 | 0.491 | 0.773 | 0.818 | 0.532 | 0.511 | 0.769 | 0.732 | 0.52 | 0.551 | 0.794 | 0.767 |
| 8 | 0.462 | 0.494 | 0.589 | 0.722 | 0.568 | 0.597 | 0.766 | 0.875 | 0.503 | 0.48 | 0.766 | 0.857 |
| 9 | 0.573 | 0.61 | 0.81 | 0.813 | 0.533 | 0.5 | 0.713 | 0.787 | 0.534 | 0.505 | 0.774 | 0.7 |
| 10 | 0.482 | 0.511 | 0.72 | 0.823 | 0.595 | 0.601 | 0.498 | 0.695 | 0.491 | 0.506 | 0.729 | 0.787 |
| 11 | 0.514 | 0.522 | 0.741 | 0.819 | 0.486 | 0.518 | 0.613 | 0.656 | 0.515 | 0.515 | 0.776 | 0.767 |
| 12 | 0.483 | 0.531 | 0.704 | 0.797 | 0.523 | 0.55 | 0.578 | 0.647 | ||||
| 13 | 0.549 | 0.527 | 0.643 | 0.684 | 0.551 | 0.567 | 0.731 | 0.71 | ||||
| FA | ADC | ||||
|---|---|---|---|---|---|
| Lesion | Normal | Lesion | Normal | ||
| ADC: apparent diffusion coefficient; CSDH: chronic subdural hematoma; FA: fractional anisotropy; ICC: intraclass correlation coefficient; ROI: region of interest. | |||||
| CSDH pre-surgery | 0.749 | 0.663 | 0.879 | 0.669 | |
| CSDH post-surgery | 0.635 | 0.665 | 0.622 | 0.733 | |
| Putamen | 0.683 | 0.787 | 0.863 | 0.712 | |
| Thalamus | 0.692 | 0.805 | 0.815 | 0.919 | |
| Subcortical | 0.799 | 0.743 | 0.924 | 0.761 | |
| Model | Variable | Coefficient (β) | Standard error | P-value |
|---|---|---|---|---|
| ADC: apparent diffusion coefficient; CSDH: chronic subdural hematoma; FA: fractional anisotropy; ICH: intracerebral hemorrhage; mRS: modified Rankin scale. | ||||
| Whole cohort | Group (CSDH vs. ICH) | 0.030 | 0.016 | 0.071 |
| Age | 6.46 × 10⁻⁶ | 0.0004 | 0.989 | |
| Location (putamen/subcortical/thalamus) | 0.010 | 0.008 | 0.207 | |
| ADC | −0.017 | 0.061 | 0.783 | |
| mRS at onset | 0.0005 | 0.003 | 0.869 | |
| mRS at discharge | 0.001 | 0.004 | 0.742 | |
| ICH group | Hematoma volume | 0.0002 | 0.0001 | 0.250 |
| Age | 0.0001 | 0.0005 | 0.774 | |
| Location (putamen/subcortical/thalamus) | 0.010 | 0.007 | 0.141 | |
| ADC | −0.048 | 0.078 | 0.540 | |
| mRS at onset | −0.0003 | 0.003 | 0.923 | |
| mRS at discharge | 0.005 | 0.004 | 0.252 | |