| Journal of Neurology Research, ISSN 1923-2845 print, 1923-2853 online, Open Access |
| Article copyright, the authors; Journal compilation copyright, J Neurol Res and Elmer Press Inc |
| Journal website https://jnr.elmerpub.com |
Original Article
Volume 16, Number 3, September 2026, pages 158-164
Longitudinal Changes in Pituitary Area in Individuals Undergoing Magnetic Resonance Imaging Checkups
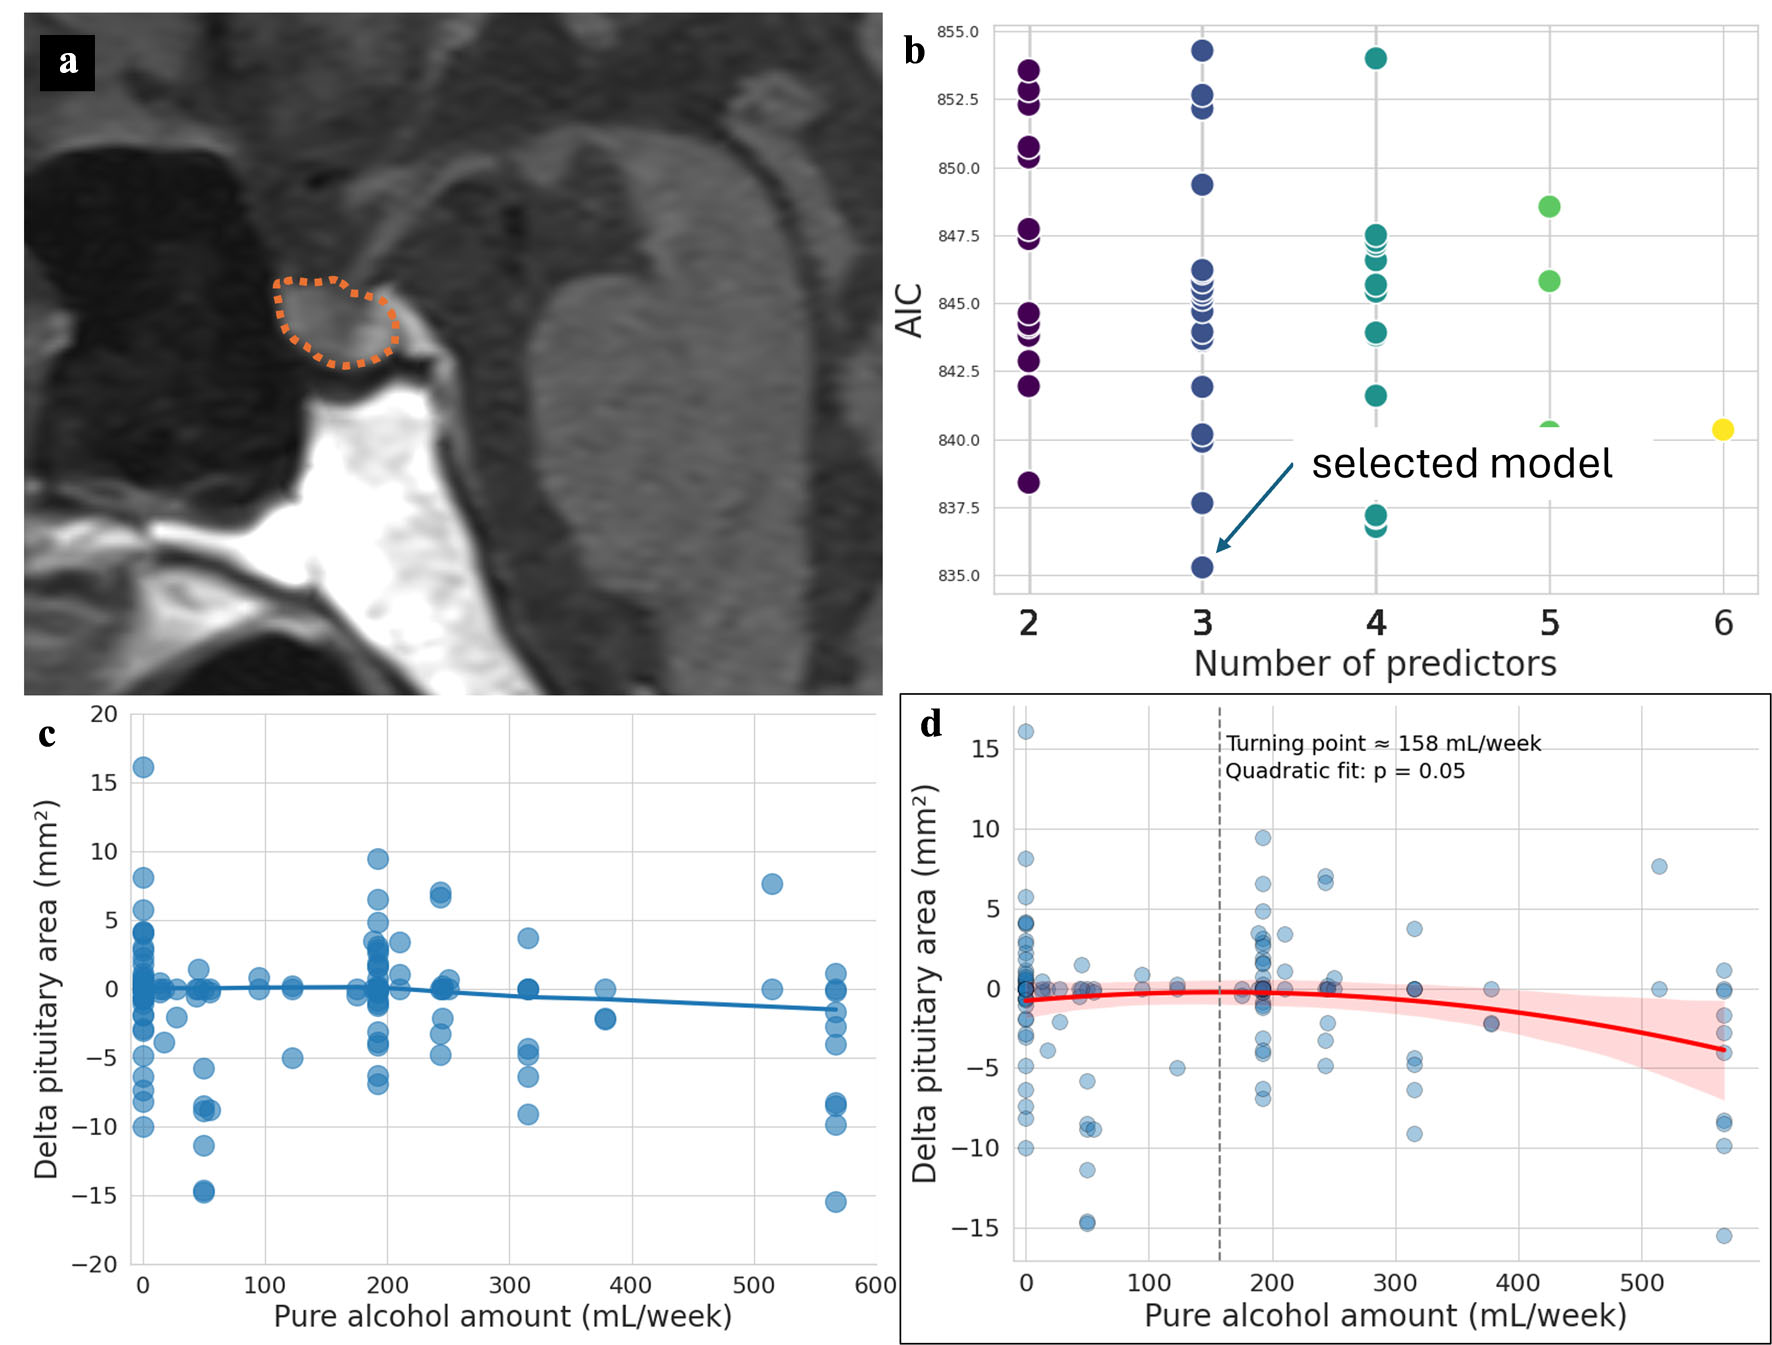
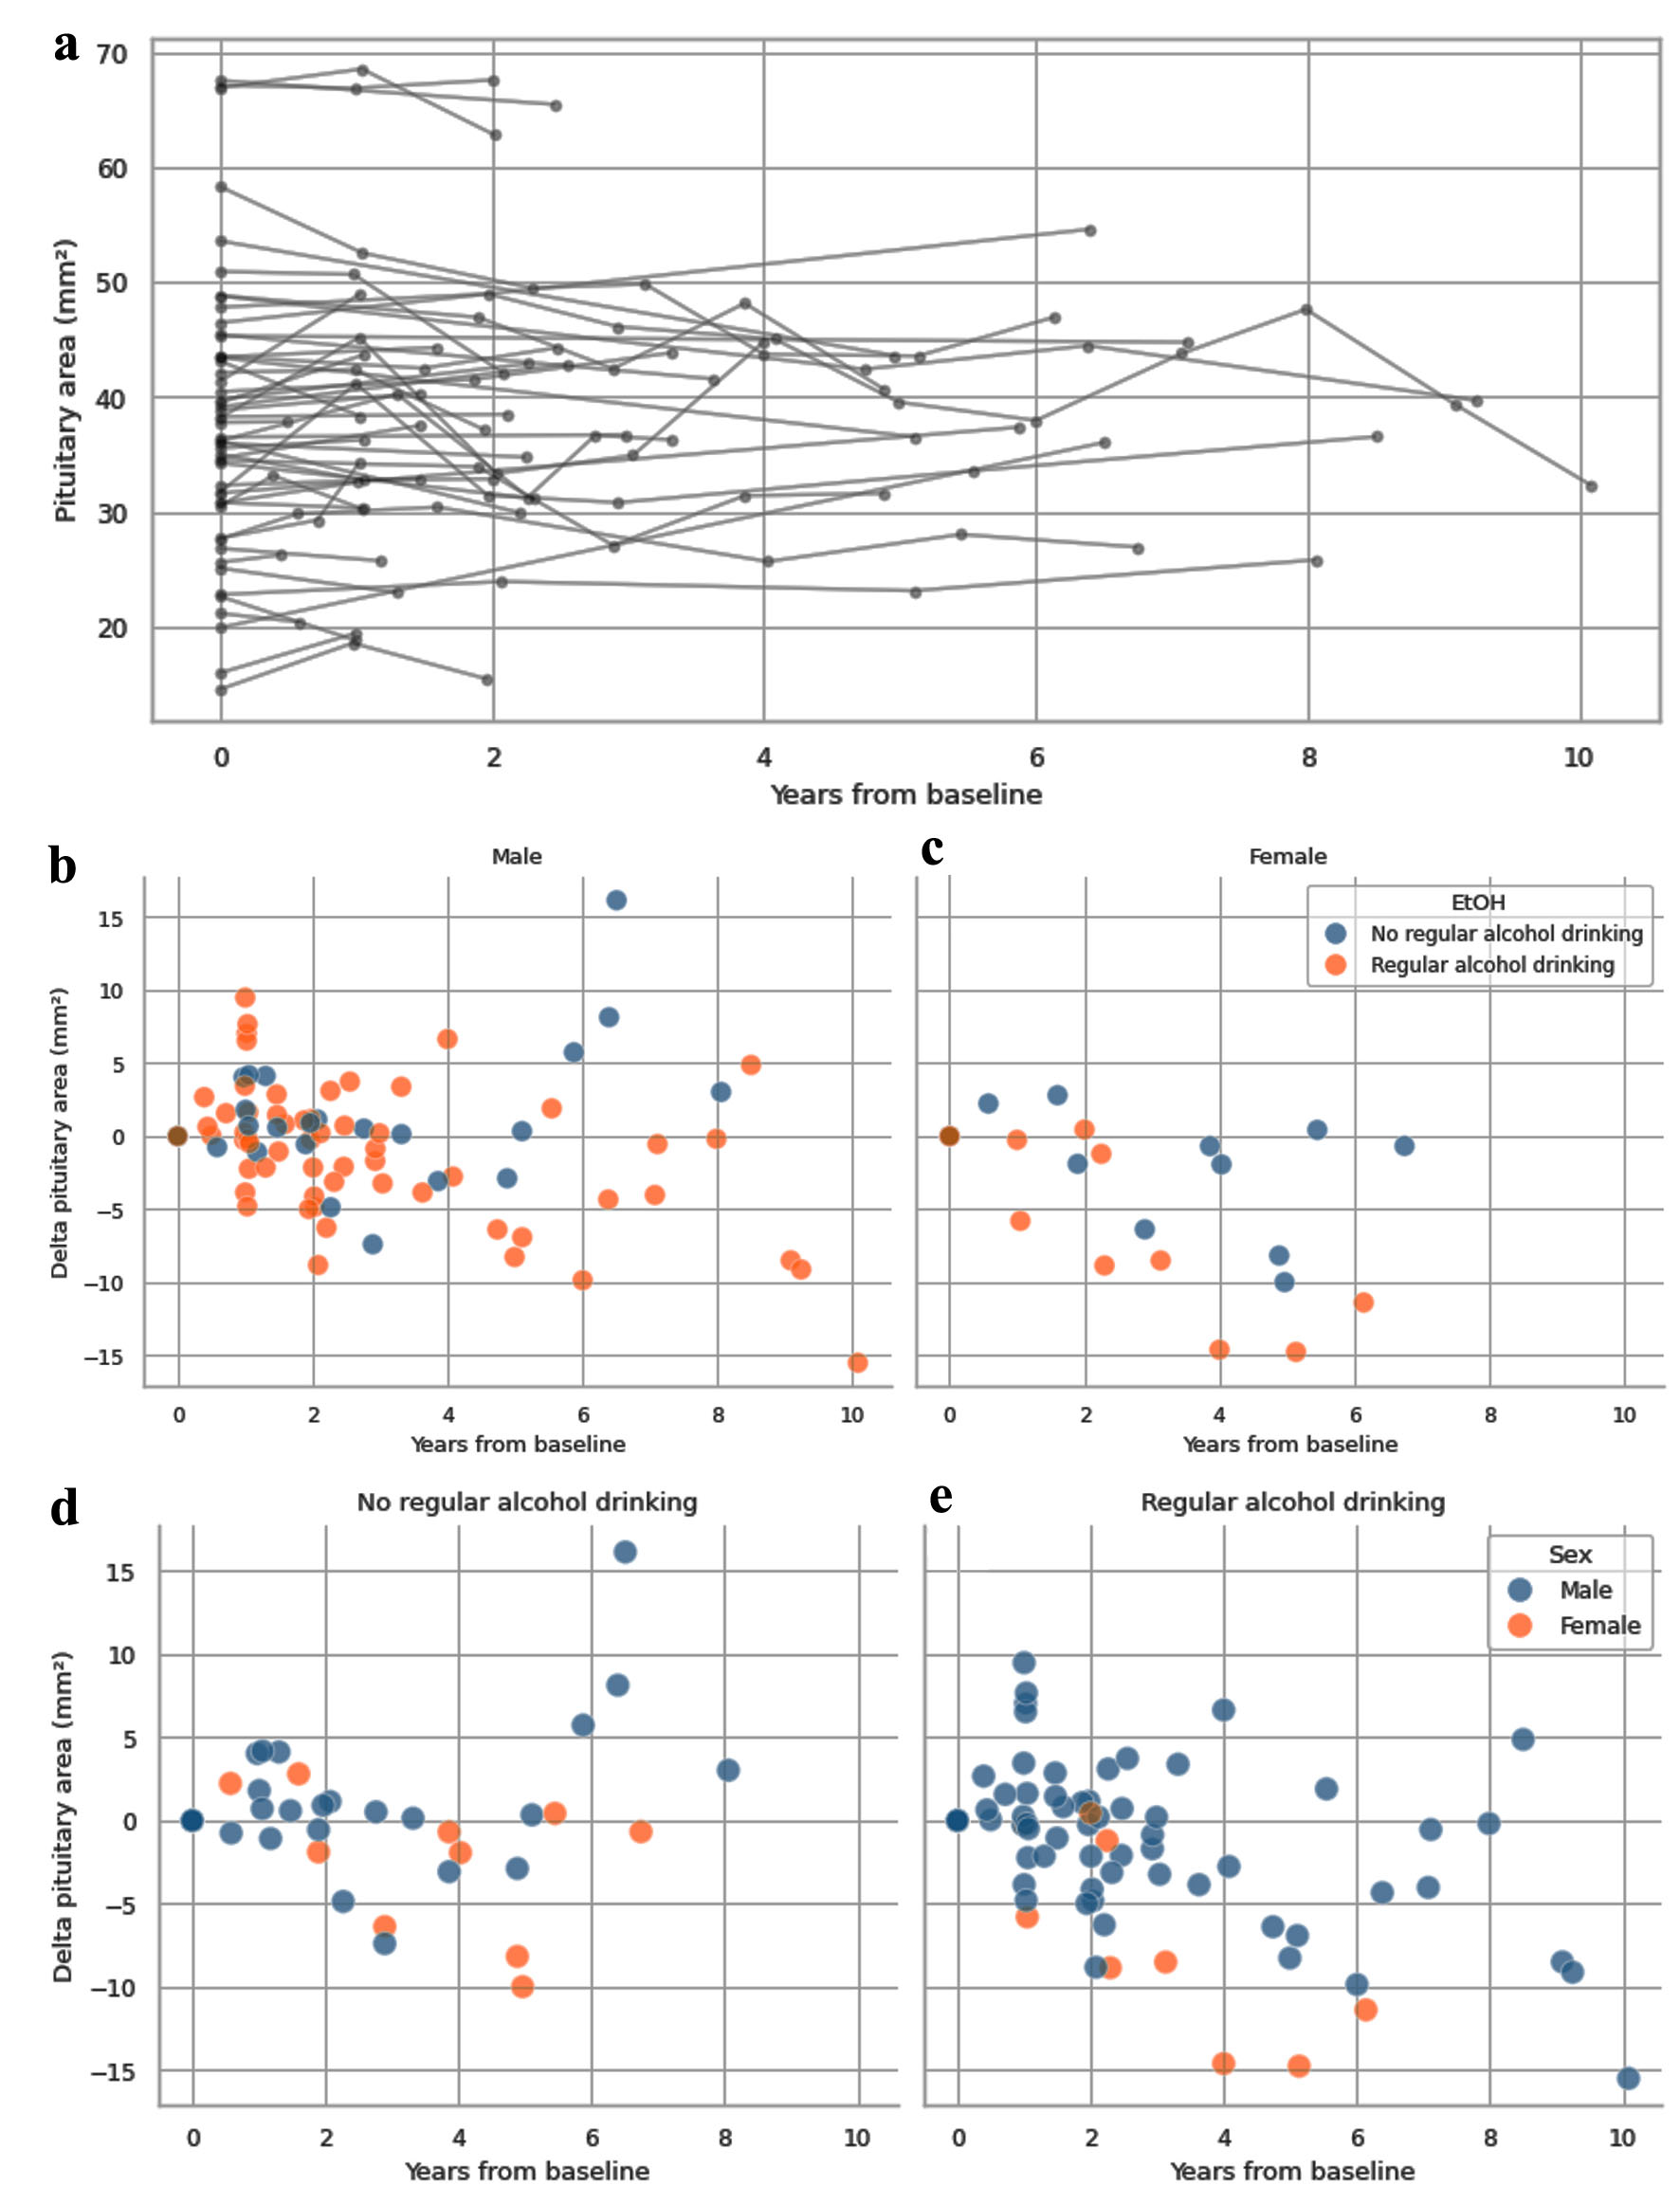
Figures


Tables
| Features | Value |
|---|---|
| IQR: interquartile range; MRI: magnetic resonance imaging. | |
| No. of patients | 52 |
| No. of MRI follow-up | 151 |
| No. of MRI follow-up per patient | |
| 2 | 32 (62%) |
| 3 | 10 (19%) |
| > 3 | 10 (19%) |
| Age at the baseline MRI (years) | 61 (IQR 50–65, range 34–79) |
| Interval between consecutive MRIs (years) | 1.05 (IQR 0.98–1.90, range 0.31–7.11) |
| Interval from first to last MRI (years) | 2.16 (IQR 1.15–4.88, range 0.44–10.08) |
| Male | 46 (88%) |
| Never-smoker | 20 (38%) |
| Drinks alcohol | 36 (69%) |
| Pure alcohol amount (mL/week) | 175 (IQR 0–193, range 0–567) |
| Pituitary area at the baseline MRI (mm2) | 37.9 ± 11.8 (range 14.6–67.5) |
| Male | Female | P | |
|---|---|---|---|
| IQR: interquartile range; MRI: magnetic resonance imaging. | |||
| N of patients | 46 | 6 | - |
| N of MRI follow-up | 126 | 25 | - |
| N of MRI follow-up per patient | 2 (IQR 2–3, range 2–10) | 4 (IQR 2–6, range 2–7) | 0.06 |
| Age at the baseline MRI (years) | 60 (IQR 48–65, range 34–79) | 62 (IQR 60–68, range 55–71) | 0.23 |
| Interval between consecutive MRI (years) | 1.05 (IQR 0.98–2.00, range 0.31–7.11) | 1.02 (IQR 1.00–1.36, range 0.57–4.96) | 0.70 |
| Interval from first to last MRI (years) | 2.05 (IQR 1.06–3.55, range 0.44–10.08) | 4.92 (IQR 2.91–5.84, range 2.00–6.74) | 0.08 |
| Never-smoker | 15 (33%) | 5 (83%) | 0.03 |
| Drinks alcohol | 33 (72%) | 3 (50%) | 0.36 |
| Pure alcohol amount (mL/week) | 193 (IQR 0–193, range 0–567) | 7 (IQR 0–41, range 0–193) | 0.08 |
| Pituitary area at the baseline MRI (mm2) | 36.6 ± 10.9 | 48.6 ± 14.6 | 0.10 |
| Univariate | Multivariable | |||
|---|---|---|---|---|
| β (95% CI) | P | β (95% CI) | P | |
| β is unstandardized coefficient. *Statistically significant. CI: confidence interval; MRI: magnetic resonance imaging. | ||||
| Age (continuous) | −0.03 (−0.11to 0.06) | 0.52 | - | - |
| Male | 3.15 (0.90–5.41) | < 0.01* | 3.28 (1.21–5.35) | < 0.01* |
| Never-smoker | −1.08 (−2.74 to 0.59) | 0.21 | - | - |
| Drinks alcohol | −1.22 (−2.98 to 0.53) | 0.17 | −1.84 (−3.39 to −0.29) | 0.02* |
| Interval from first to last MRI (years, continuous) | −0.44 (−0.71 to −0.17) | < 0.01* | −0.44 (−0.70 to −0.18) | < 0.01* |