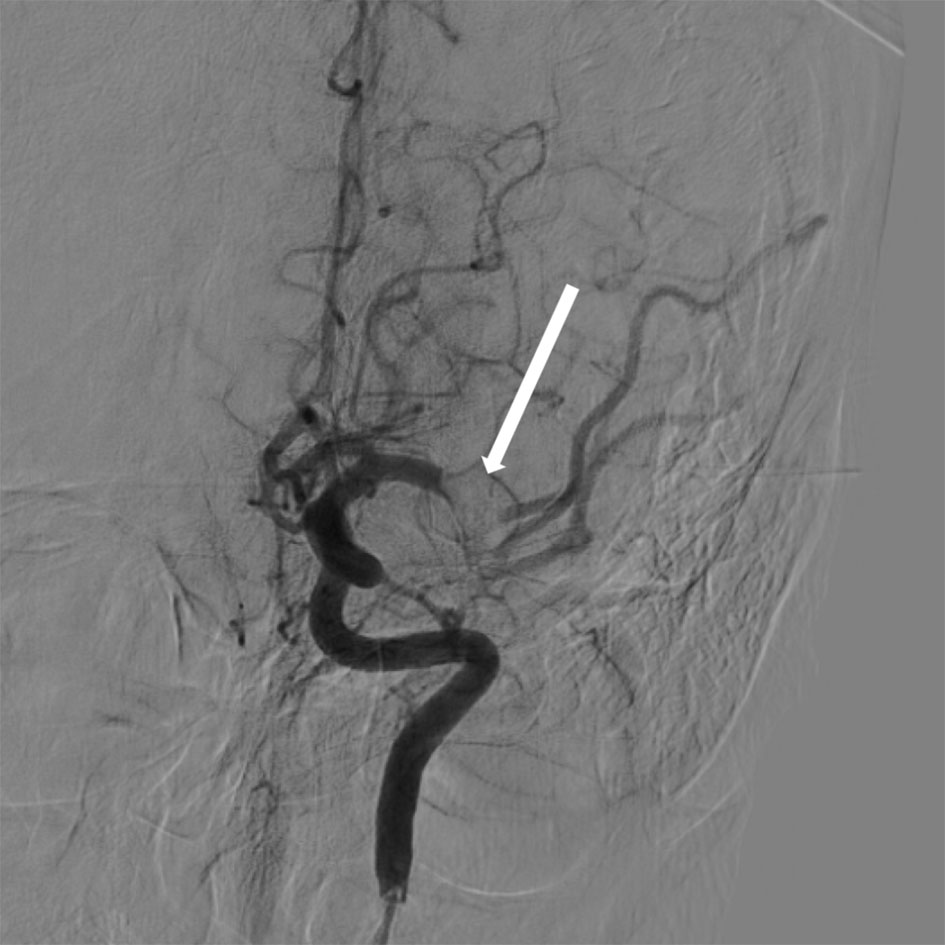
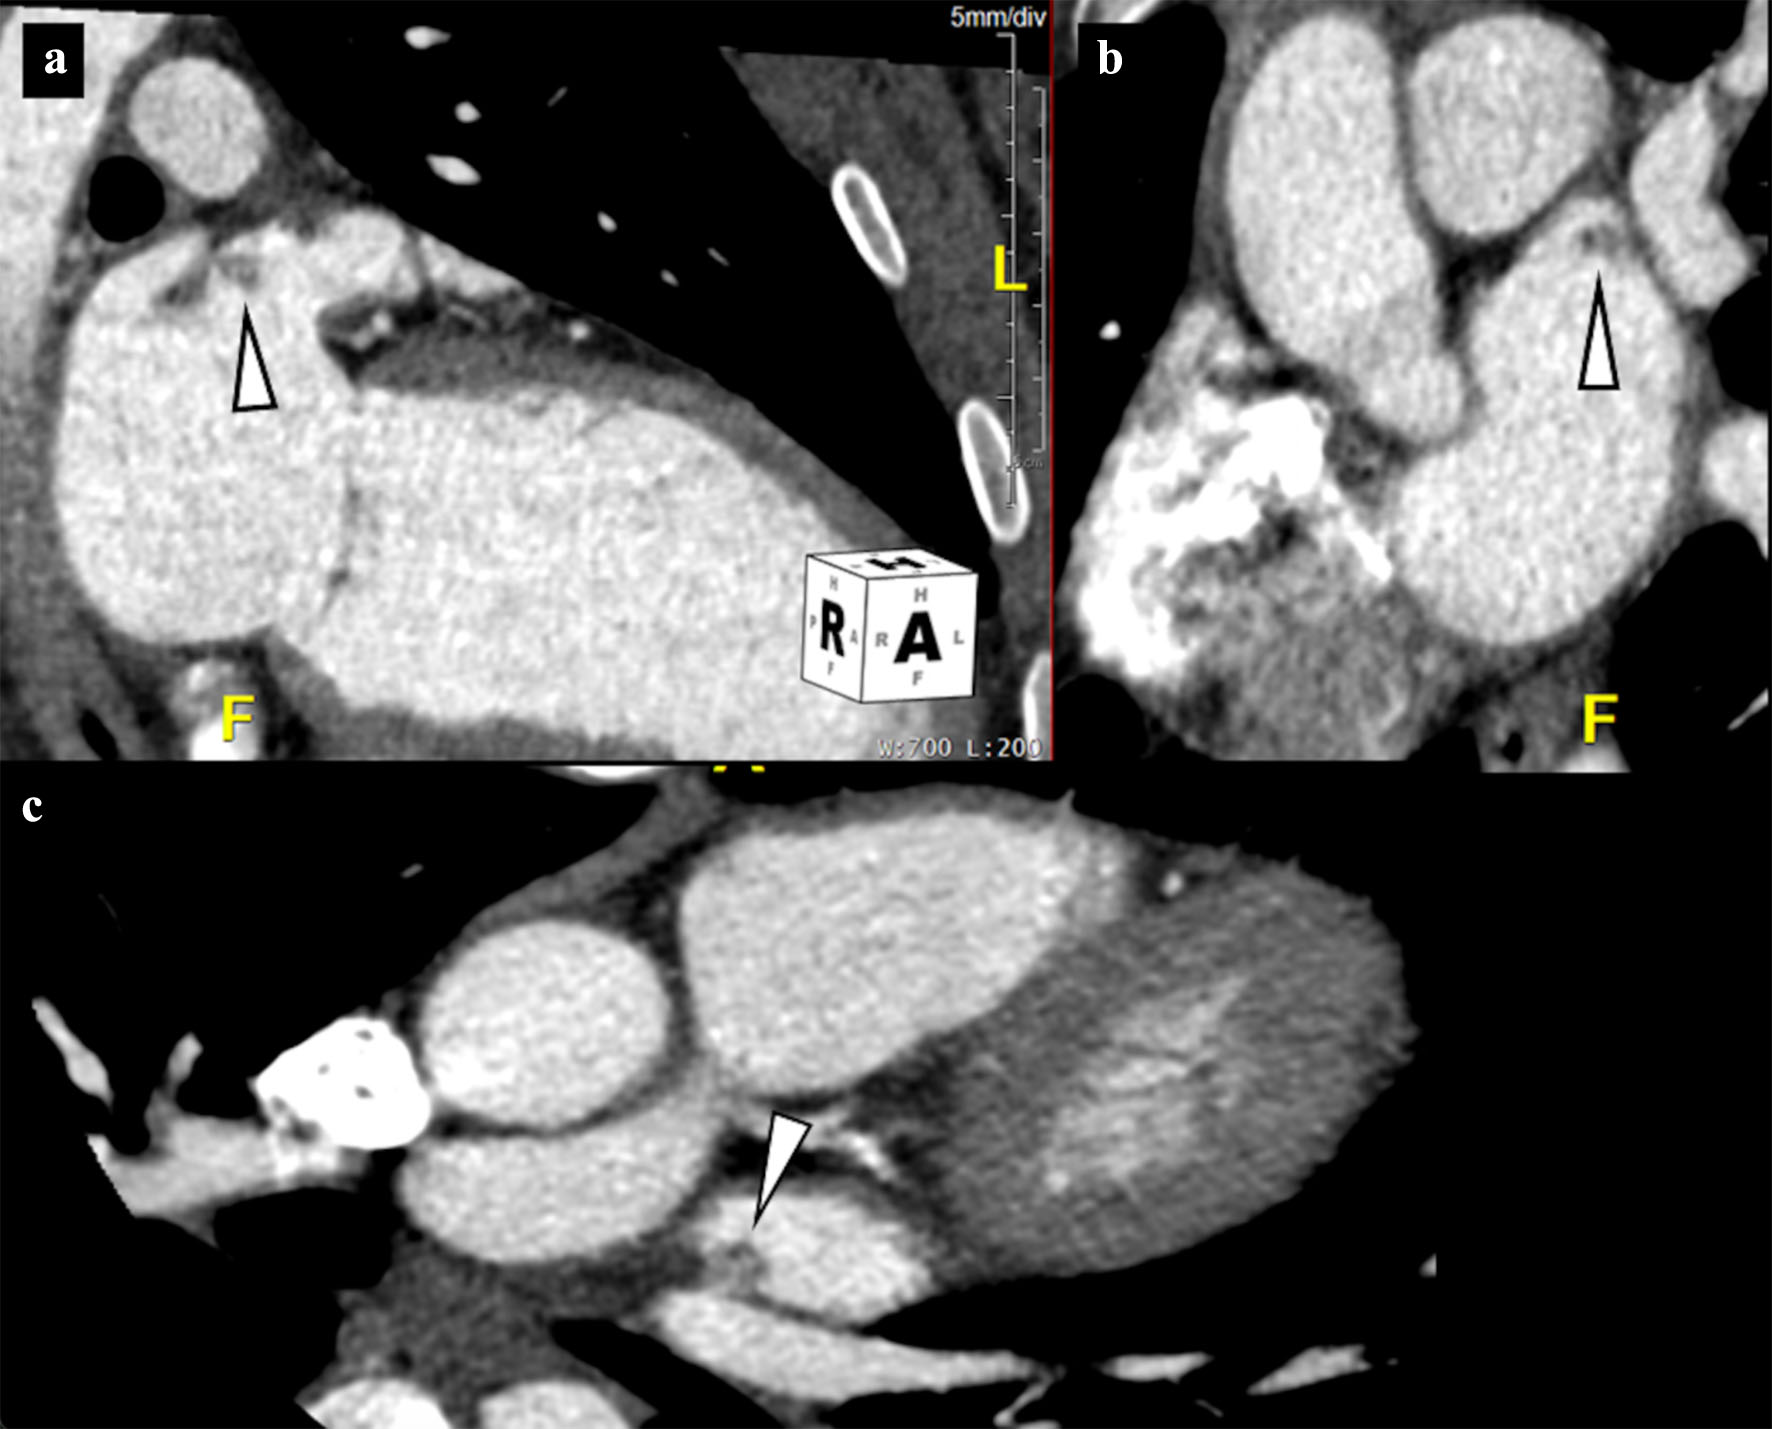
↓ Figure 2. Gated contrast-enhanced cardiac computed tomography with multiplanar reconstructions demonstrates a 6 mm lesion attached to the proximal left atrial appendage, located approximately 5 mm from its ostium (arrow). (a) Two-chamber view. (b) Cardiac short-axis view. (c) Off-axis four-chamber oblique view. Histopathologic examination of embolic material retrieved during cerebral thrombectomy performed five days earlier confirmed papillary fibroelastoma.
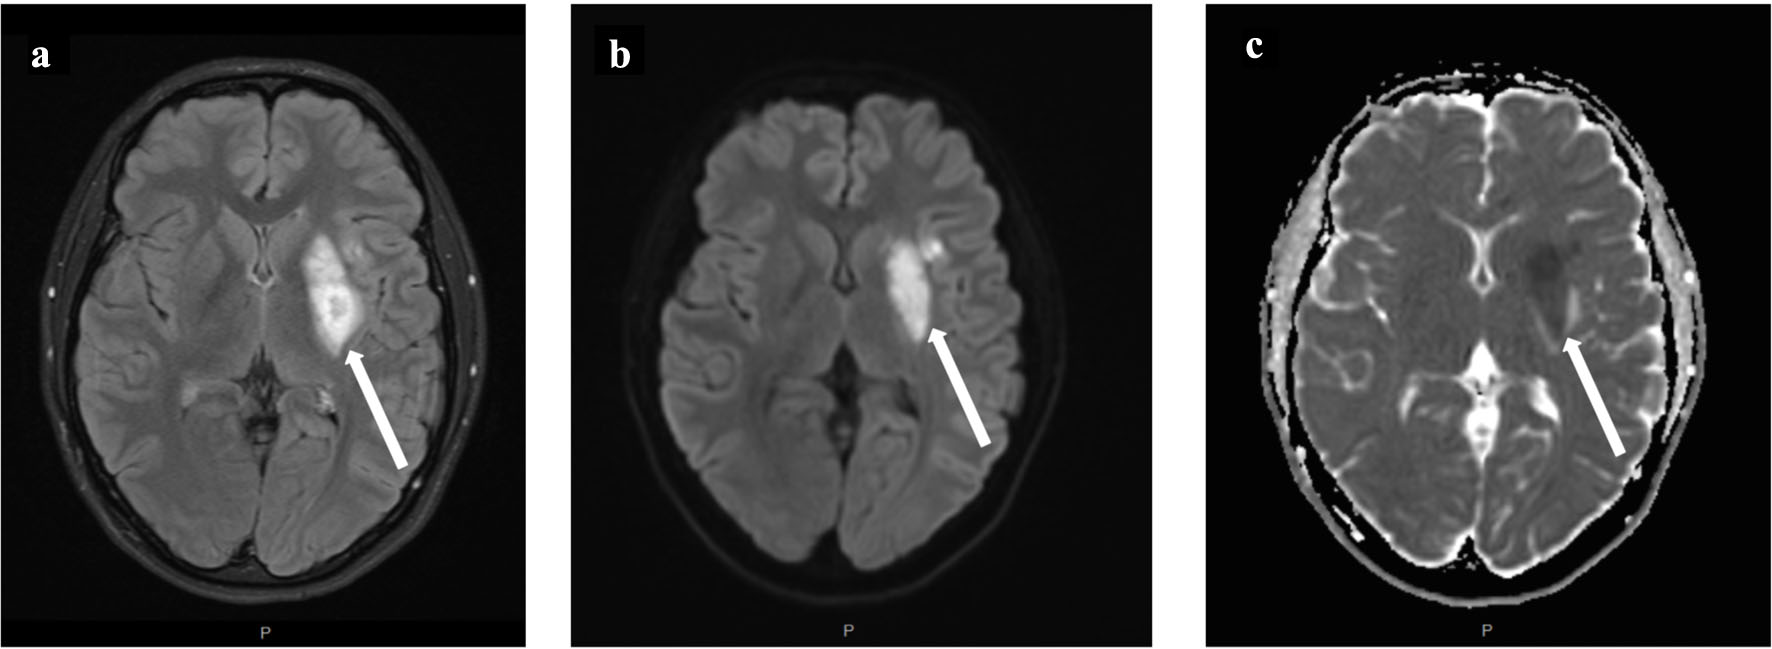
↓ Figure 3. Post-treatment magnetic resonance imaging of the brain demonstrates evolving infarction without hemorrhagic transformation. Arrows indicate regions of infarction involving the left caudate tail, lentiform nucleus, and corona radiata. (a) Fluid-attenuated inversion recovery imaging. (b) Diffusion-weighted imaging. (c) Apparent diffusion coefficient map confirms true diffusion restriction.
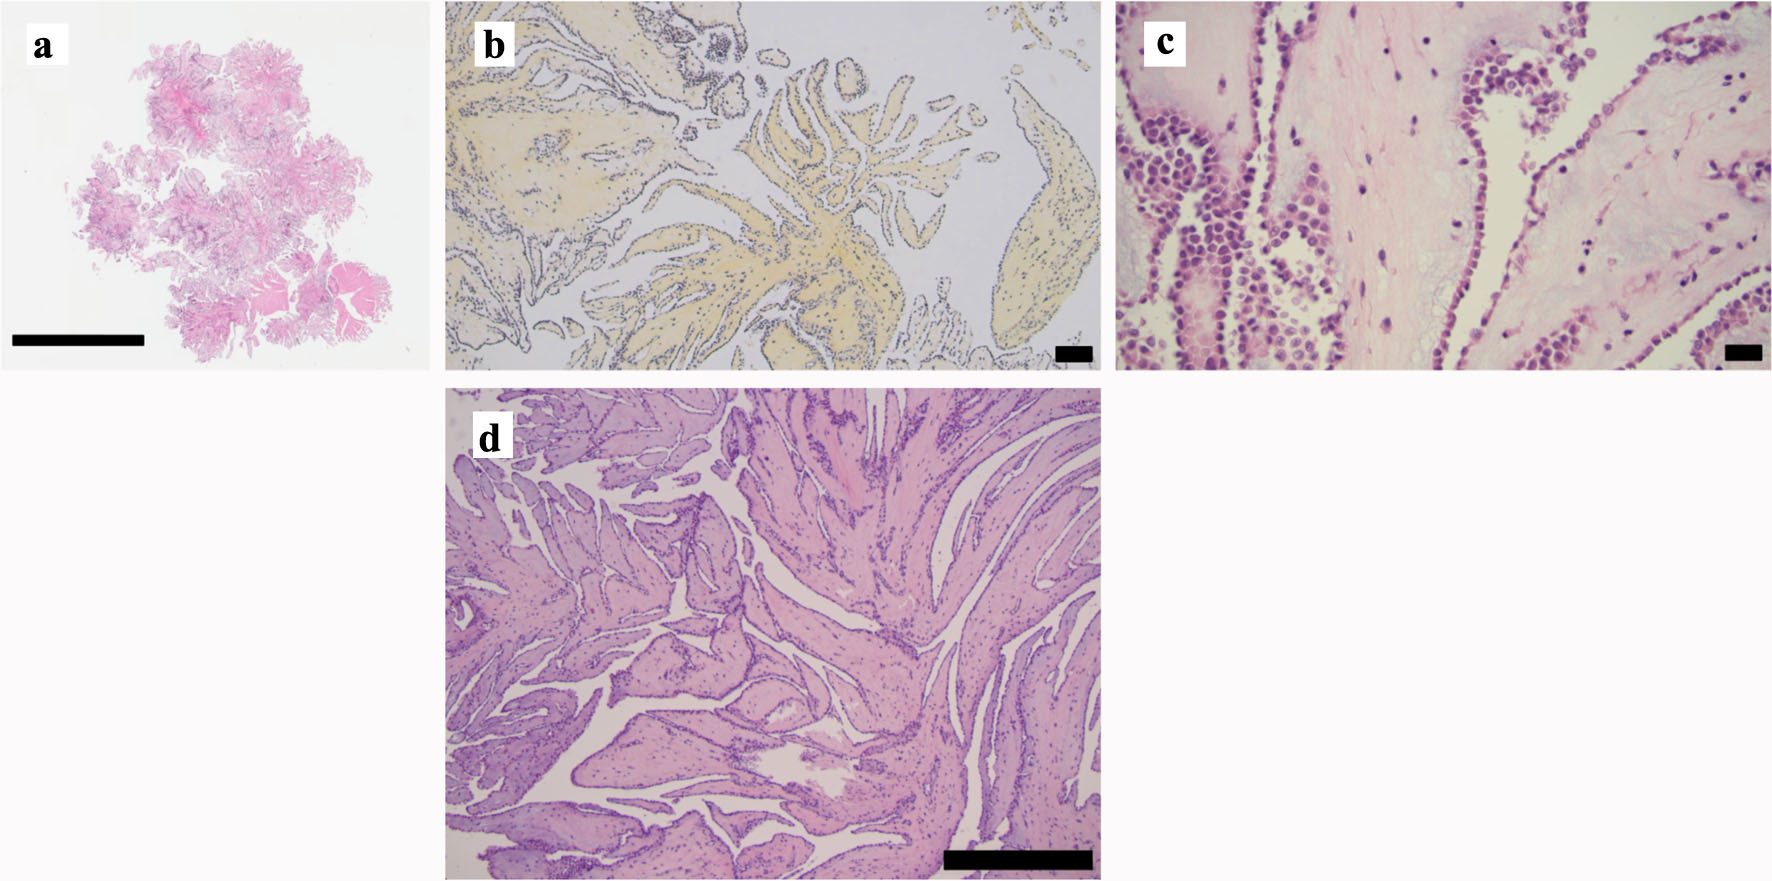
↓ Figure 4. Histopathologic examination of (a–c) thrombectomy-retrieved embolus and (d) surgically resected papillary fibroelastoma. (a) Hematoxylin and eosin (H&E) low-power view reveals the papillary structure. (b) Hematoxylin-phloxine-saffron staining highlights the collagenous nature of the papillary cores. (c) H&E high-power view demonstrates a single layer of cuboidal cells lining the papilla. (d) Hematoxylin and eosin-stained section of the surgically resected left atrial lesion confirming papillary fibroelastoma. Scale bars: a = 4 mm, b = 250 µm, c = 50 µm, d = 500 µm.