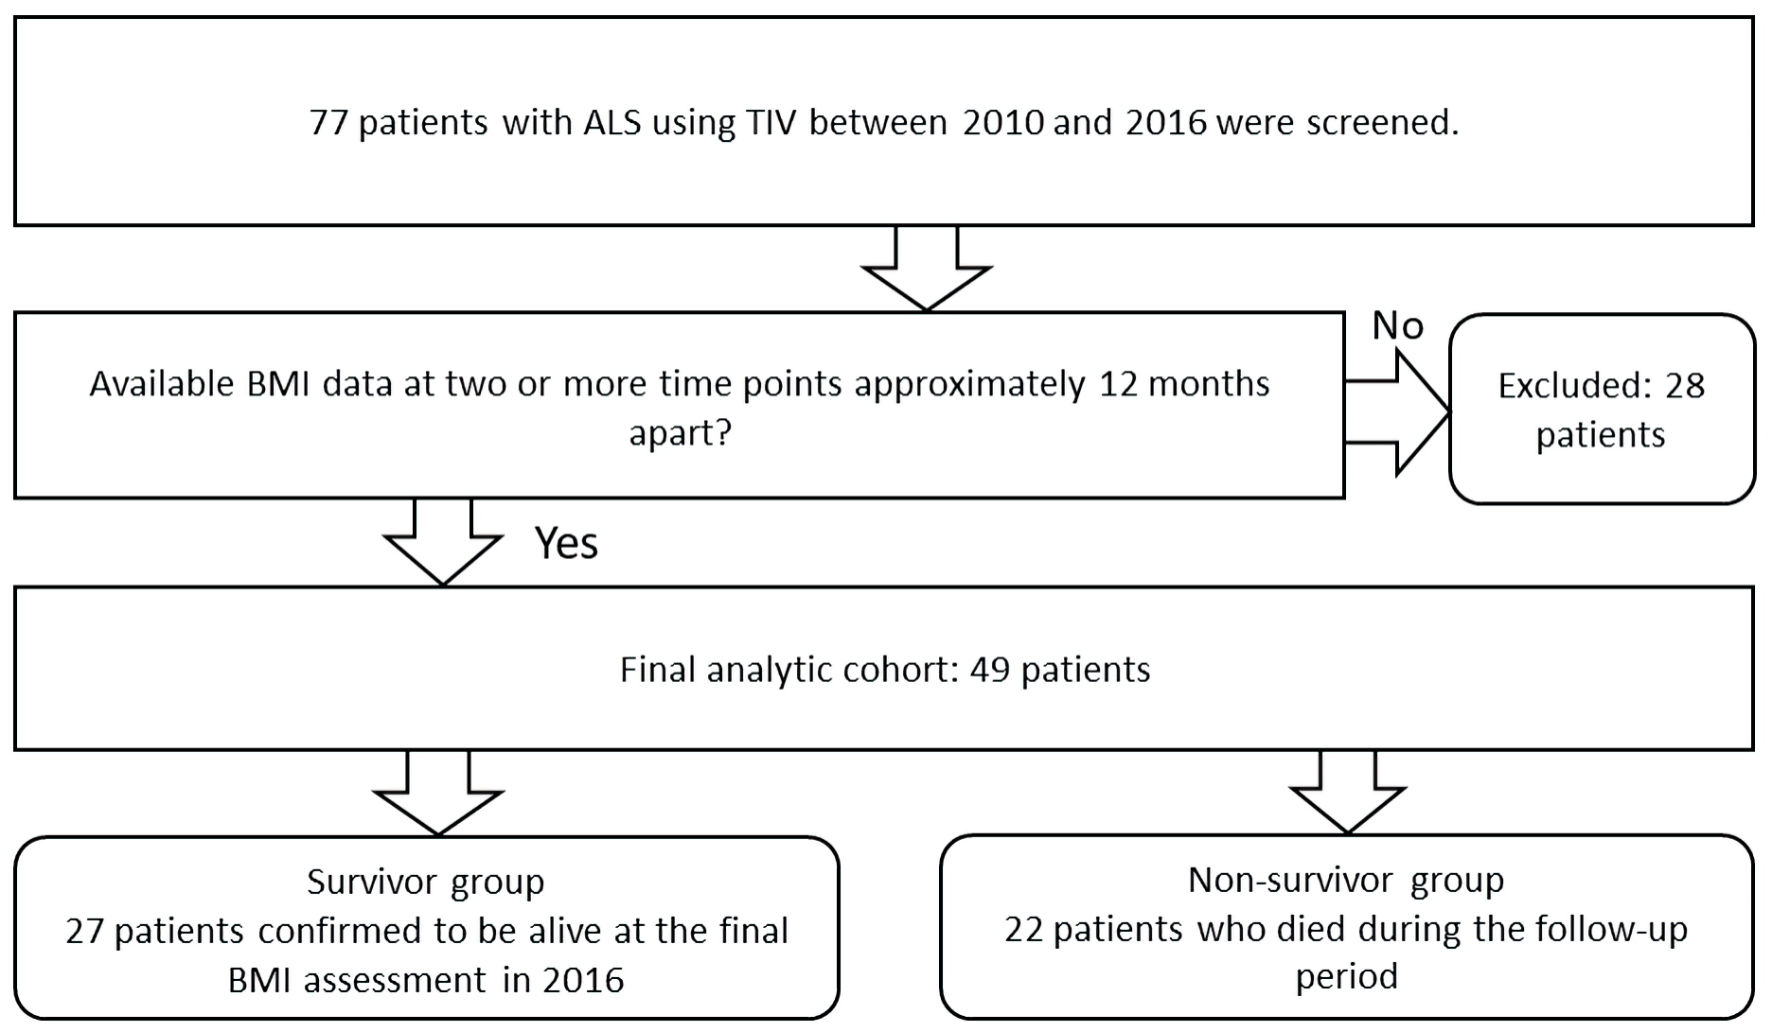
↓ Figure 1. Patient selection flowchart. ALS: amyotrophic lateral sclerosis; BMI: body mass index; TIV: tracheostomy invasive ventilation.
| Journal of Neurology Research, ISSN 1923-2845 print, 1923-2853 online, Open Access |
| Article copyright, the authors; Journal compilation copyright, J Neurol Res and Elmer Press Inc |
| Journal website https://jnr.elmerpub.com |
Short Communication
Volume 16, Number 4, December 2026, pages 263-269
Annual Body Mass Index Change and Mortality in Patients With Amyotrophic Lateral Sclerosis Using Tracheostomy Invasive Ventilation
Figures
Tables
| Variables | Survivor group (n = 27) | Non-survivor group (n = 22) | P value |
|---|---|---|---|
| Data are presented as median (interquartile range) or number (%). Percentages were calculated within each group. The P value for site of onset was calculated after excluding patients with unknown onset site. Time since PEG insertion was calculated only for patients who had undergone PEG. P values were calculated using the Mann–Whitney U test for continuous variables and Fisher’s exact test for categorical variables. ALSFRS-R: ALS Functional Rating Scale–Revised; PEG: percutaneous endoscopic gastrostomy; TIV: tracheostomy invasive ventilation. | |||
| Age, years | 71.0 (66.5–75.0) | 71.5 (67.3–77.3) | 0.9193 |
| Sex, n (%) | 0.0078 | ||
| Male | 11 (40.7) | 18 (81.8) | |
| Female | 16 (59.3) | 4 (18.2) | |
| Site of onset, n (%) | 1.0000 | ||
| Bulbar | 1 (3.7) | 1 (4.5) | |
| Limb | 12 (44.4) | 10 (45.5) | |
| Unknown | 14 (51.9) | 11 (50.0) | |
| ALSFRS-R total score | 2.0 (1.0–4.0) | 2.5 (1.0–4.0) | 0.7506 |
| Disease duration, months | 84.0 (53.8–113.5) | 88.0 (65.0–120.0) | 0.7949 |
| Enteral feeding route, n (%) | 1.0000 | ||
| PEG | 22 (81.5) | 18 (81.8) | |
| Nasogastric tube | 5 (18.5) | 4 (18.2) | |
| Time since PEG insertion, months | 42.5 (27.8–73.5) | 55.5 (25.5–63.0) | 0.9312 |
| Time since TIV initiation, months | 16.5 (16.0–19.0) | 18.0 (14.0–22.0) | 0.8246 |
| Variable | Survivor group (n = 27) | Non-survivor group (n = 22) | P value |
|---|---|---|---|
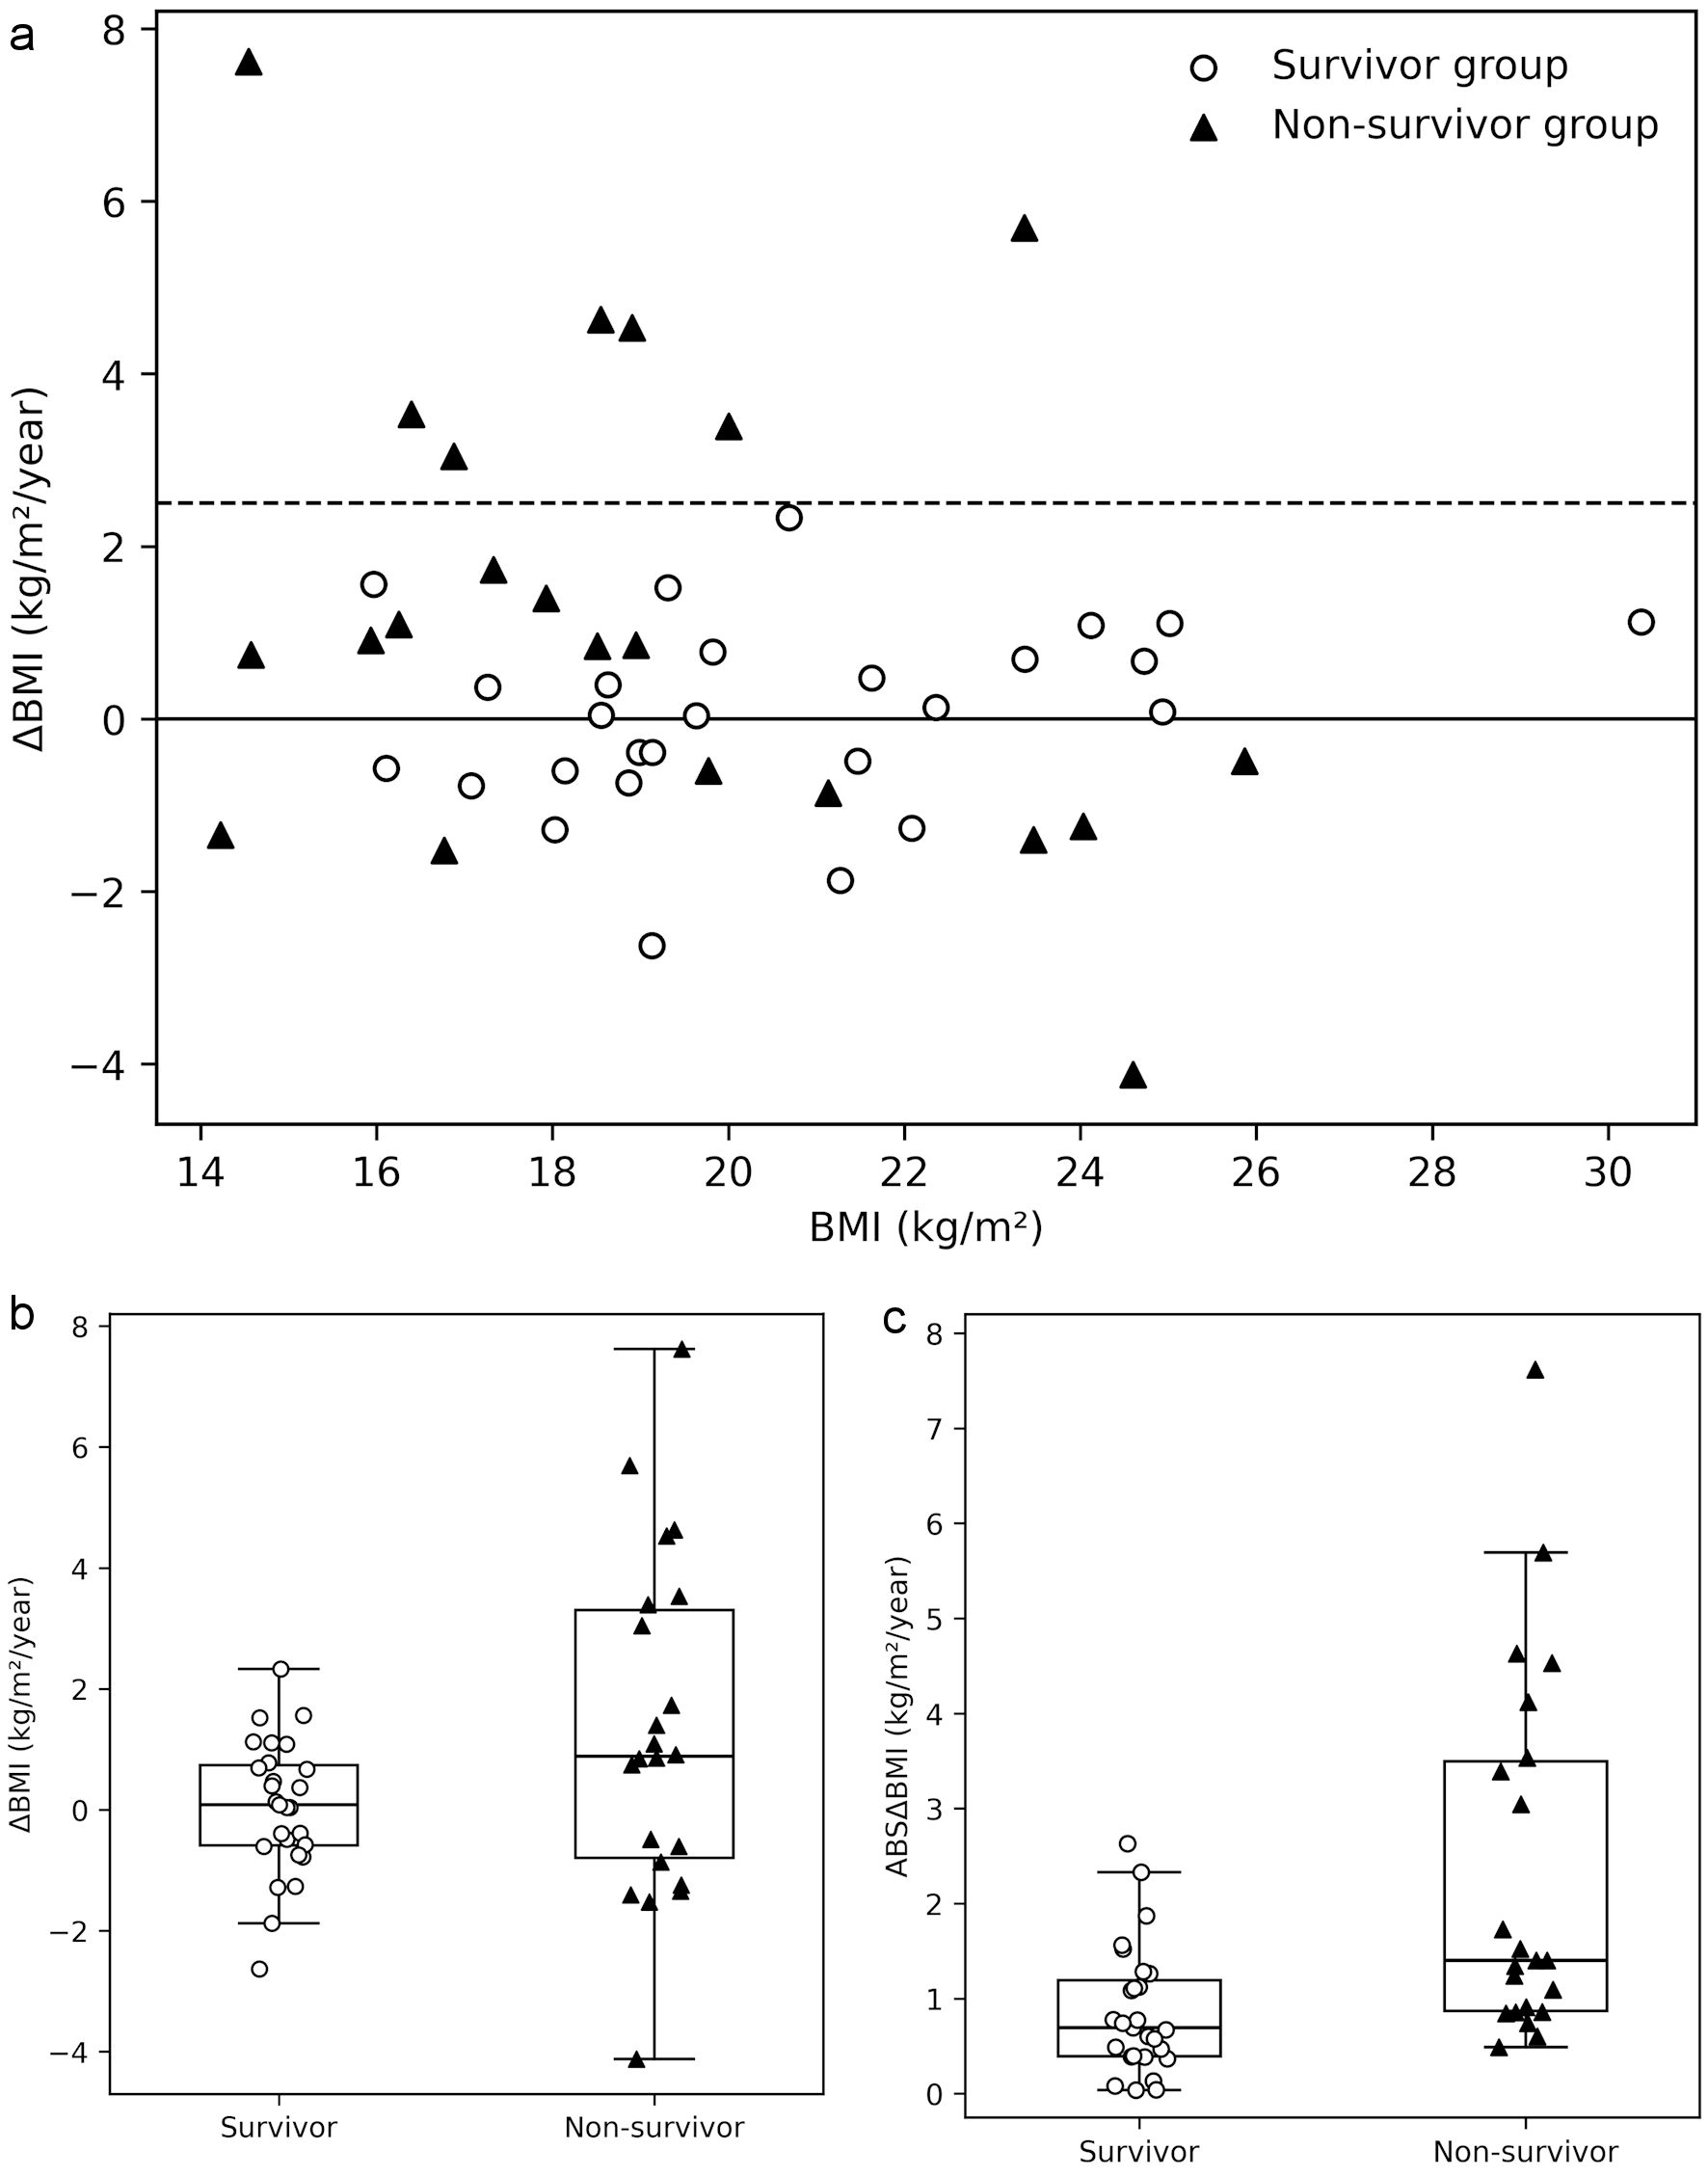
| Data are presented as median (interquartile range) or number (%). P values were calculated using the Mann–Whitney U test for continuous variables and Fisher’s exact test for categorical variables. BMI: body mass index; ΔBMI: annual change in body mass index; ABSΔBMI: absolute annual change in body mass index. | |||
| BMI, kg/m2 | 19.6 (18.6–22.2) | 19.9 (19.1–22.6) | 0.8813 |
| ΔBMI, kg/m2/year | 0.1 (-0.6–0.7) | 0.9 (-0.8–3.3) | 0.1352 |
| ABSΔBMI, kg/m2/year | 0.7 (0.4–1.2) | 1.4 (0.9–3.5) | 0.0003 |
| ΔBMI ≥ 2.5 kg/m2/year, n (%) | 0 (0.0) | 7 (31.8) | 0.0020 |