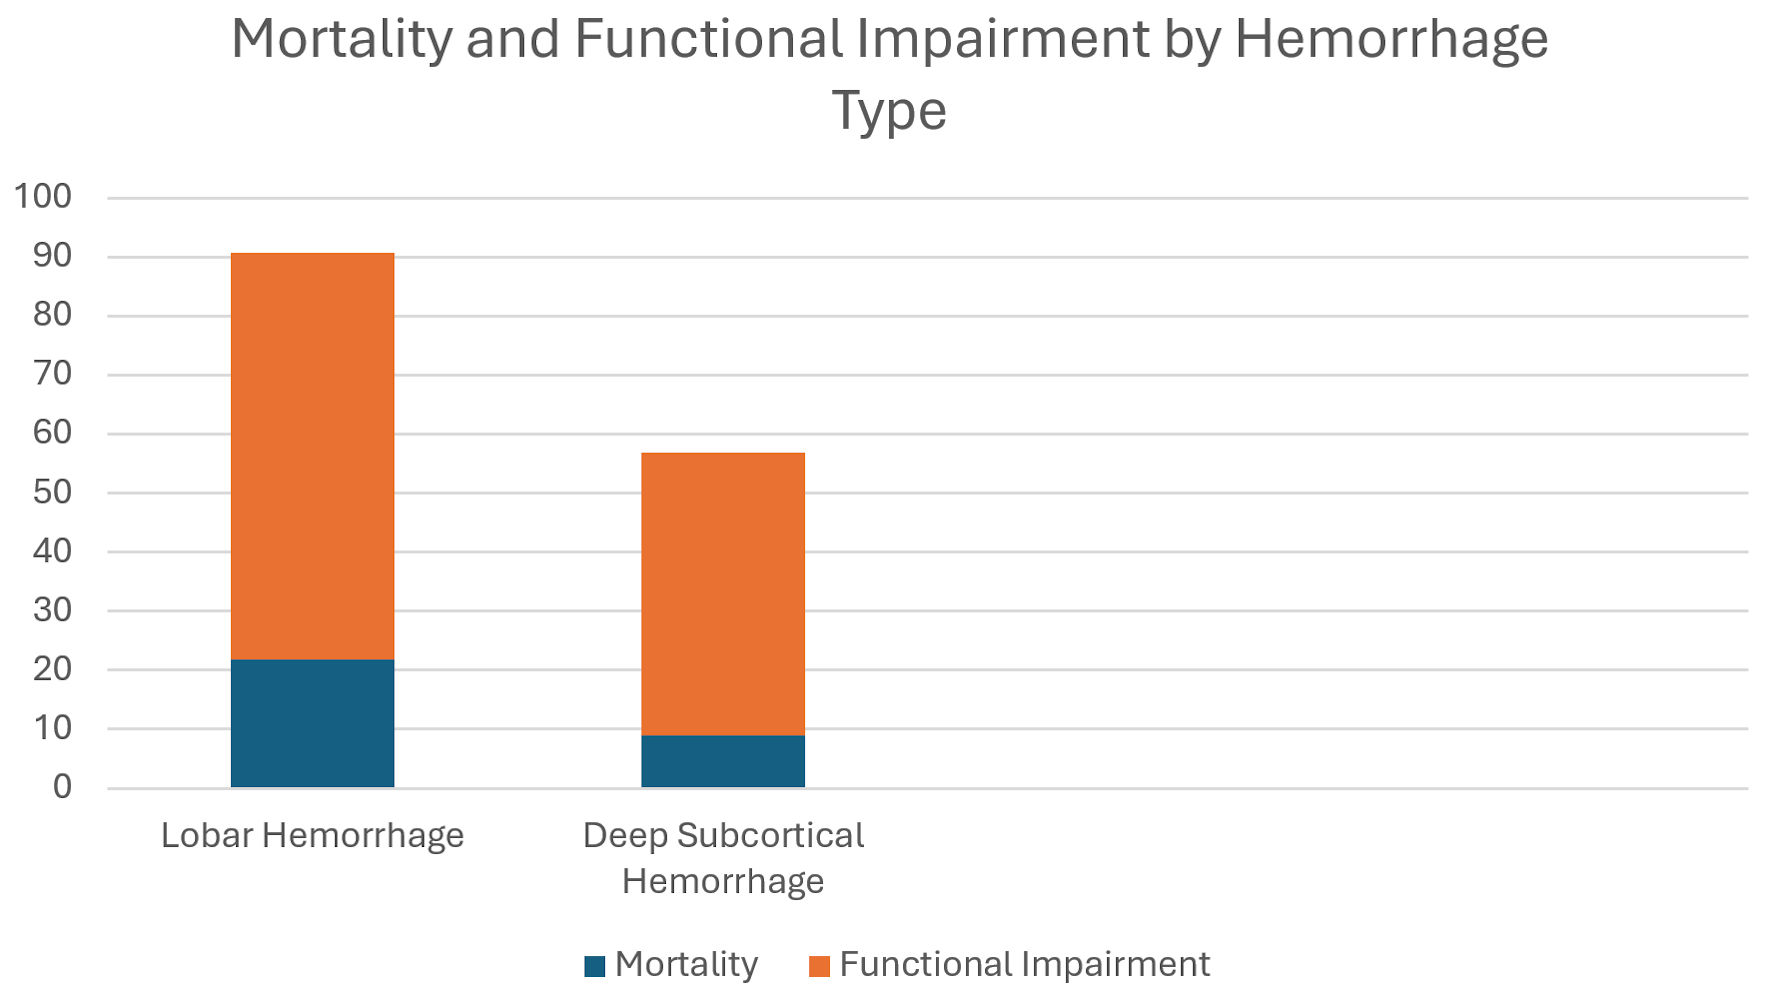
↓ Figure 1. Mortality and functional impairment
by hemorrhage type.
| Journal of Neurology Research, ISSN 1923-2845 print, 1923-2853 online, Open Access |
| Article copyright, the authors; Journal compilation copyright, J Neurol Res and Elmer Press Inc |
| Journal website https://jnr.elmerpub.com |
Original Article
Volume 15, Number 1, January 2025, pages 33-38
The Role of Erythrocyte Sedimentation Rate as a Prognostic Factor in Intracerebral Hemorrhage
Figure
Tables
| Characteristic | Total (n = 82) | High ESR (n = 35) | Normal ESR (n = 47) |
|---|---|---|---|
| ESR: erythrocyte sedimentation rate; GCS: Glasgow Coma Scale; ICH: intracerebral hemorrhage. | |||
| Age (years) | 65 (47 - 89) | 68 (47 - 89) | 62 (47 - 89) |
| Male (%) | 54.9 | 57.1 | 53.2 |
| Female (%) | 45.1 | 42.9 | 46.8 |
| GCS (score) | 10.5 | 9.8 | 11.2 |
| ICH volume (mL) | 42.6 | 46.8 | 35.2 |
| Hypertension (%) | 72.5 | 77.1 | 68.1 |
| Diabetes (%) | 25 | 28.6 | 21.3 |
| Atrial fibrillation (%) | 18.7 | 22.9 | 14.9 |
| Outcome | Total (n = 82) | High ESR (n = 35) | Normal ESR (n = 47) | P | Sensitivity | Specificity | PPV (%) | NPV (%) |
|---|---|---|---|---|---|---|---|---|
| ESR: erythrocyte sedimentation rate; PPV: positive predictive value; NPV: negative predictive value. | ||||||||
| Mortality (%) | 13.4 | 20.0 | 8.5 | 0.03 | 63.2% | 61.8% | 20% | 91.5% |
| Functional impairment (%) | 56.1 | 65.7 | 34.0 | 0.002 | 65.2% | 70.8% | 85.7% | 53.2% |
| Mean hospital stay (days) | 18.5 | 12.3 | 0.01 | |||||
| Rehabilitation needs (%) | 58.6 | 31.9 | 0.005 | |||||
| Variable | OR | 95% CI | P value |
|---|---|---|---|
| ESR: erythrocyte sedimentation rate; OR: odds ratio; CI: confidence interval; ICH: intracerebral hemorrhage. | |||
| Elevated ESR (mortality) | 2.5 | 1.2 - 5.3 | 0.01 |
| Elevated ESR (functional impairment) | 3.1 | 1.5 - 6.5 | 0.002 |
| Age (years) | 1.05 | 1.02 - 1.08 | < 0.001 |
| ICH volume (mL) | 1.03 | 1.01 - 1.05 | 0.01 |
| Marker | Correlation (r) | P value |
|---|---|---|
| CRP: C-reactive protein. | ||
| CRP | 0.65 | < 0.001 |
| Leukocyte count | 0.53 | 0.01 |
| Subgroup | OR | 95% CI | P value |
|---|---|---|---|
| OR: odds ratio; CI: confidence interval. | |||
| Age > 70 (mortality) | 3.8 | 1.7 - 8.3 | 0.001 |
| Gender (male, functional impairment) | 3.4 | 1.7 - 7.0 | 0.001 |