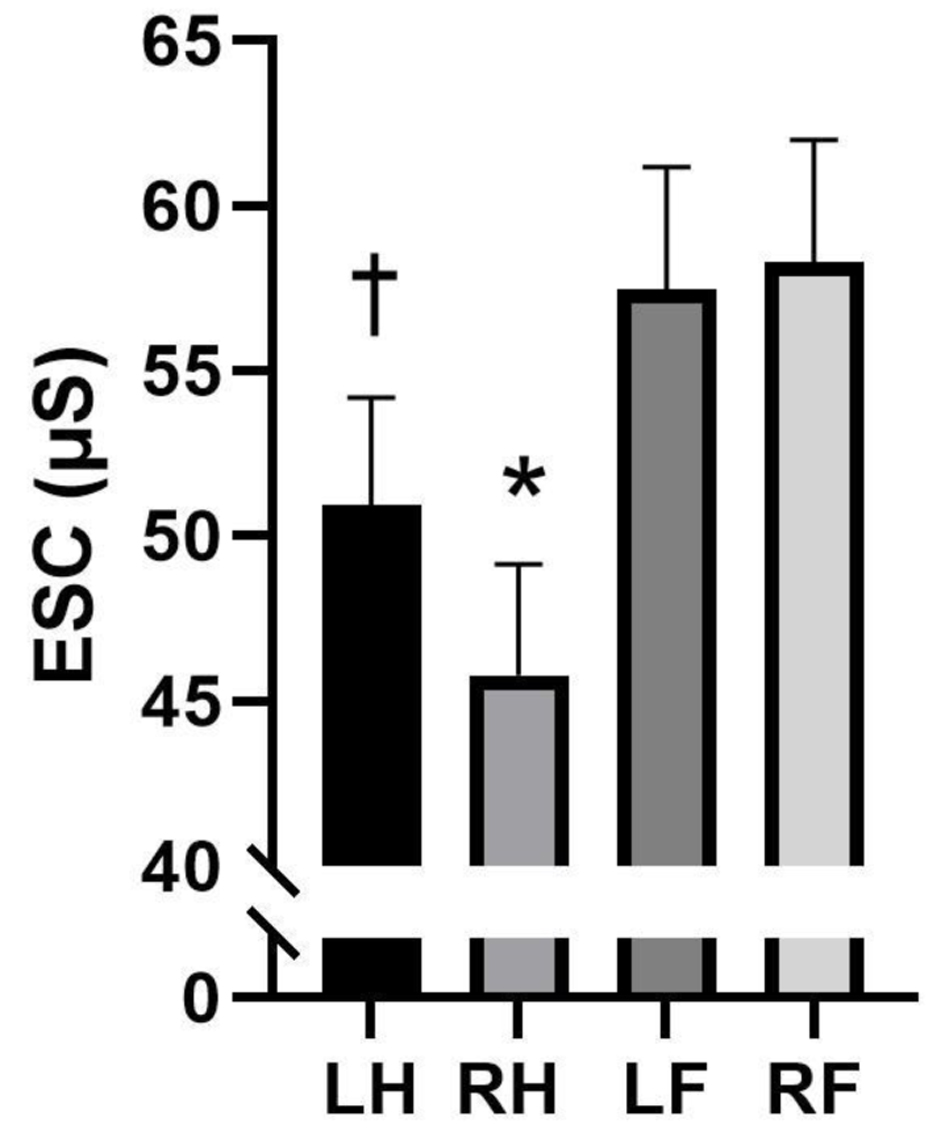
Journal of Neurology Research, ISSN 1923-2845 print, 1923-2853 online, Open Access
Article copyright, the authors; Journal compilation copyright, J Neurol Res and Elmer Press Inc
Journal website https://jnr.elmerpub.com

Original Article

Volume 15, Number 2, March 2025, pages 71-76


The Impact of Metabolic Control on Limb Differences in Peripheral Neuropathy: A Pilot Study

Figures

Figure 1.
Figure 1. Differences in electrochemical skin conductance (ESC) differences between limbs (n = 34). Analysis of variance. Data are presented as mean ± standard error of mean (SEM). *Statistically significant from left hand (LH), left foot (LF), and right foot (RF). Statistically significant from LF and RF.
Figure 2.
Figure 2. Relationships between fasting glucose and electrochemical skin conductance (ESC) in (a) left hand (LH), (b) right hand (RH), and (c) right foot (RF) (n = 34). Pearson’s correlation.

Table

Table 1. Overall Participant Characteristics
 
VariableOverall (n = 34)Men (n = 8)Women (n = 26)P-value
Data are presented as mean ± SD; independent samples t-test. *Statistically significant. BMI: body mass index; BUN: blood urea nitrogen; HbA1c: hemoglobin A1c; NHB: non-Hispanic Black; NHW: non-Hispanic White.
Demographic
  Age (years)57 ± 1457 ± 1157 ± 150.954
  Race (NHW/NHB)24/106/218/80.763
  Height (cm)65.6 ± 4.069.8 ± 4.264.3 ± 3.0< 0.001*
  Weight (kg)184 ± 31205 ± 25178 ± 300.021*
  BMI (kg/m2)30.1 ± 5.229.6 ± 2.530.3 ± 5.80.752
Clinical laboratory values
  Glucose (mg/dL)107 ± 34109 ± 27106 ± 360.841
  HbA1c (%)5.9 ± 1.16.0 ± 0.55.9 ± 1.20.853
  BUN (mg/dL)15.3 ± 5.716.1 ± 5.115.0 ± 6.00.646
  Vitamin B12 (pg/mL)1,086 ± 600717 ± 1581,173 ± 6350.178
  Folate (ng/mL)16.9 ± 5.313.7 ± 4.817.6 ± 5.30.189
  Vitamin D (ng/mL)46.2 ± 32.440.5 ± 14.447.6 ± 35.80.705