| Journal of Neurology Research, ISSN 1923-2845 print, 1923-2853 online, Open Access |
| Article copyright, the authors; Journal compilation copyright, J Neurol Res and Elmer Press Inc |
| Journal website https://jnr.elmerpub.com |
Original Article
Volume 000, Number 000, June 2025, pages 000-000

Neuroprotective Effects of Calcium Channel Blockers on Parkinson’s Disease Development: A Population Cohort Study
Shivani Waghmarea, Samrawit Zinabub, Miriam Michaelb, d, Christian Wonga, Noah Wheatona, Girma Ayeleb, Tabitha Nortona, Tia Tysona, Jerome Wattsa, Peyton Smitha, Ahmed Alic
aHoward University School of Medicine, Washington DC, USA
bHoward University Hospital Department of Internal Medicine, Howard University, Washington DC, USA
cHoward University Hospital Department of Hematology/Oncology, Howard University, Washington DC, USA
dCorresponding Author: Miriam Michael, Howard University Hospital Department of Internal Medicine, Howard University, Washington DC, USA
Manuscript submitted March 7, 2025, accepted June 2, 2025, published online June 16, 2025
Short title: Neuroprotective Effects of CCBs on PD
doi: https://doi.org/10.14740/jnr1023
| Abstract | ▴Top |
Background: Parkinson’s disease (PD) is the second most common neurodegenerative disorder. There have been studies showing that hypertension (HTN) has an increased risk for PD as well as numerous studies published which show an overall neuroprotective effect on the prevention of PD. Although this correlation is established, the potential role of antihypertensives, especially calcium channel blockers (CCB), in preventing PD has not been studied extensively in the USA with a diverse set of racial groups.
Methods: This study employed a retrospective cohort study using the TriNetX database, investigating the incidence of PD in hypertensive patients from a wide variety of racial groups prescribed CCBs compared to those receiving beta-blockers (BBs).
Results: In this large cohort study, 364,898 patients were included in each group for the final analysis. The analysis revealed that the risk of developing PD in the CCB group had a risk ratio of 0.3, while in the BB group, it had a risk ratio 0.4. The risk difference between the CCB and BB groups was -0.1 (95% confidence interval (CI): -0.001, -0.001). This indicates a statistically significant protective effect of CCBs on the development of PD.
Conclusion: These results suggest that CCBs provide a slight protective effect against developing PD. Further research may be warranted to explore underlying mechanisms and validate these findings.
Keywords: Retrospective cohort study; Parkinson’s disease; Hypertension; Calcium channel blockers; Beta-blockers; Neuroprotective effects
| Introduction | ▴Top |
Parkinson’s disease (PD) is the second most common neurodegenerative disorder, and its prevalence is expected to double by 2030 due to the aging global population [1]. PD is characterized by destruction of dopaminergic (DA) neurons in the substantia nigra pars compacta (SNc) in the brain along with the deposition of Lewy bodies in the same region of the brain. Various risk factors have been studied that are associated with the development of PD. A meta-analysis conducted by Hou et al concluded that pre-existing hypertension (HTN) is a risk factor for development of PD [1]. Additionally, studies in Taiwan and Finland have identified a significant association between HTN and an increased risk of PD [2]. Scientists hypothesize that hypertensive vasculopathy may affect connections between the substantia nigra and the putamen [3]. An additional etiology that is widely studied for the development of PD is calcium hemostasis. Calcium (Ca2+) signaling is a fundamental process in biology, and its disruption is increasingly recognized as a key factor in aging and neurodegeneration. What makes PD distinct is that several PD-associated genes directly impact calcium homeostasis, leading to abnormal Ca2+ flux from both the plasma membrane and intracellular stores [4]. Specifically, the L-type calcium channels, which are heterogeneously found in the brain, particularly more concentrated in the nigral neurons, are implicated in generating generation mitochondrial oxidant stress that contributes to the apoptosis of DA neurons - a key component of the PD pathophysiology [5, 6]. Given this pathophysiology, there have been several studies undertaken to understand the roles of CCBs which can block the calcium channels and provide an overall protective effect against PD. A retrospective cohort study done in Denmark suggested a possible neuroprotective effect with the use of dihydropyridine (DHP) CCBs which specifically target L-type calcium channels [7]. Furthermore, DHP CCBs have demonstrated the ability to mitigate mitochondrial dysfunction and rescue DA neurons in the substantia nigra of PD model mice [8]. Despite these promising findings, further prospective studies are necessary to clarify the mechanisms by which CCBs may evoke their neuroprotective effect.
There are many cohort studies conducted to assess the neuroprotective roles of CCBs, although most of them have been done for a small sample size and limited population demographics. For instance, a nationwide cohort study conducted by Lee et al previously suggested that the use of centrally acting DHP CCBs may be associated with a reduced incidence of PD amongst hypertensive patients only limited to the Taiwan population [2]. This limited population diversity is concerning as it causes issues with making these study results more biased for a certain population as well as having limited generalizability. Additionally, there can be potential genetic and environmental factors contributing to these observed differences in the different populations. Thus, there is a need to create studies that encompass diverse populations of different races.
Our study aimed to evaluate the effects of CCBs on the risk of PD within North American populations to address the gap in knowledge regarding the potential protective effects of CCBs against PD in a context that includes varied genetic and environmental backgrounds seen in North America. The primary reason to use BB as our control is because it was one of the common medications used for PD in the market until the development of CCBs as well as renin-angiotensin agents [9]. Additionally, beta-blockers (BBs) are effective in PD management because they compete with norepinephrine at receptor sites, thereby reducing its activity in the brain. Since norepinephrine system disturbances are believed to contribute to both the onset and progression of PD, especially by impacting the dopamine-producing nigrostriatal pathway, BBs help by modulating this imbalance. By limiting excessive norepinephrine signaling, BBs may provide neuroprotective effects for PD [10]. In summary, the objective of this study was to investigate the potential protective effects of CCBs on the risk of developing PD in North American populations, using BBs as a comparative control to better understand how these commonly prescribed antihypertensive agents may offer a neuroprotective role in the development of the disease.
| Materials and Methods | ▴Top |
Study design
We conducted a retrospective cohort study and included patients with a diagnosis of essential HTN on or before the date of December 31, 2018. De-identified electronic health records (EHRs) spanning 20 years (January 1, 1999 to December 31, 2018) were sourced from the TriNetX database.
The data reviewed are a secondary analysis of existing data, do not involve intervention or interaction with human subjects, and are de-identified according to the de-identification standard defined in the HIPAA Privacy Rule.
Data source
TriNetX is a global health research network that provides researchers with access to clinical data from 95 healthcare organizations, including diagnoses, procedures, medications, laboratory values, and genomic information.
Defining the cohorts
Patients were categorized based on specific query criteria into two cohorts. Cohort 1 included patients with a diagnosis of essential HTN treated with CCBs. Cohort 2 included patients with a diagnosis of essential HTN treated with BBs.
Setting up and running the analysis
This involved defining the index event, the time frame, and outcome criteria. Index event: The point in time when each patient enters the analysis, defined as the first occurrence of the selected cohort criteria. Time window: Outcomes were analyzed from the same day as the index event and continued for 1 year. Outcome: The primary outcome of interest was the occurrence of PD.
Data analysis
In total, there were three different data analyses run: 1) Comparison of Cohort 1 (CCBs) vs Cohort 2 (BBs i.e control group) in terms of outcome and risk analysis of PD diagnosis 2) Comparison of cohorts treated with Cohort 3 (dihydropyridines) vs. Cohort 4 (non-dihydropyridines) and the outcome and risk analysis of PD diagnosis 3) Comparison of cohorts treated with Cohort 5 amlodipine vs. Cohort 6 nifedipine for HTN and outcome and risk analysis of PD diagnosis.
The data analysis process included two main steps: 1) defining the cohorts through query criteria; 2) setting up and running the analysis. There were two main cohorts that were defined with certain inclusion and exclusion criteria as shown in Figure 1. Both cohorts were patients diagnosed with primary (essential) HTN (UMLS: ICD-10-CM: I10). Cohort 1 included patients treated with CCBs, and cohort 2 included patients treated with BBs (control group). More details on the query logic as well as the inclusion and exclusion criteria are detailed in the Supplementary Material 1 (jnr.elmerpub.com).
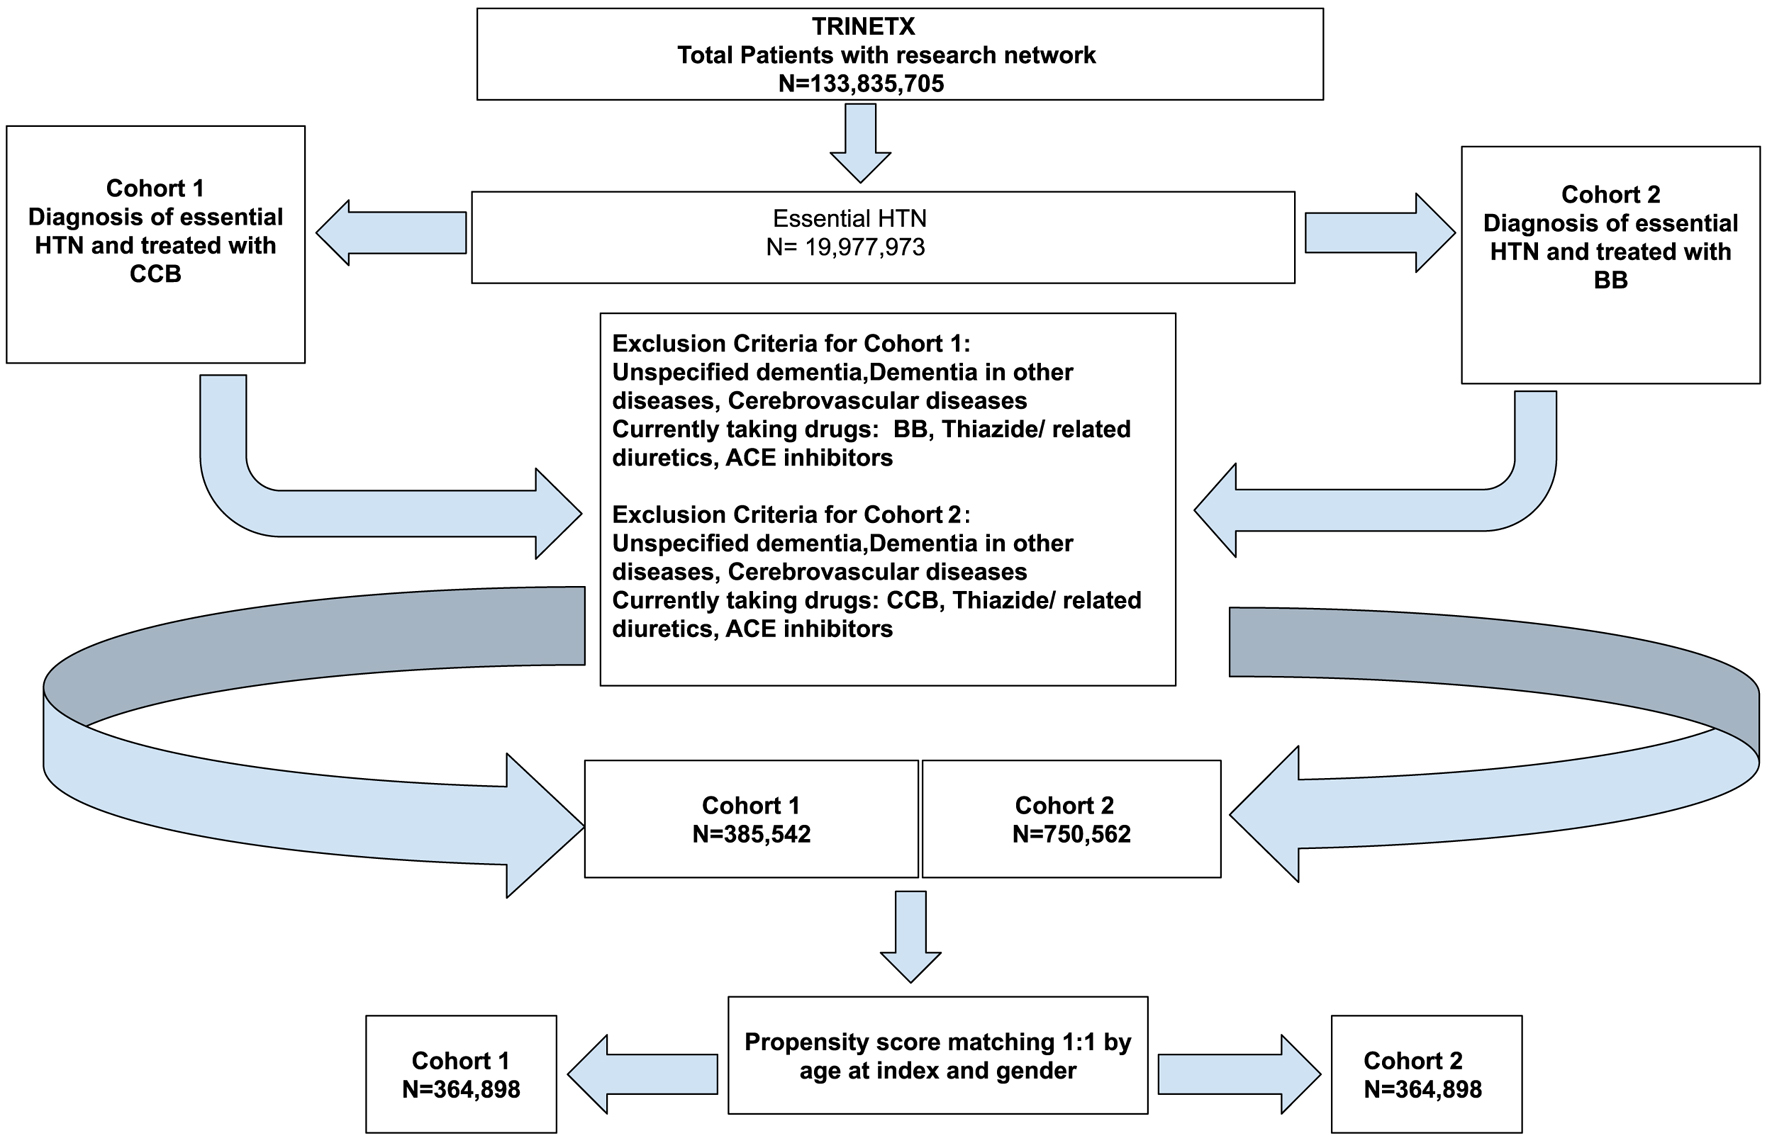 Click for large image | Figure 1. Cohort definition flowchart for cohort 1 (CCB) and cohort 2 (BB). ACE: angiotensin-converting enzyme; BB: beta-blocker; CCB: calcium channel blocker. |
Risk analysis for PD development was conducted separately in two groups of patients with essential HTN: those treated with CCB and those treated with BB. Cohort 1 (CCB) vs. cohort 2 (BB) which is the control group were compared in terms of outcome and risk analysis of PD diagnosis. Table 1 indicates the demographics of the study cohorts before and after propensity score matching. Figure 2 describes the graph before and after propensity score matching. Propensity score matching was done using a 1:1 nearest neighbor approach and the covariates included were age and sex. These were the only confounding variables adjusted for.
 Click to view | Table 1. Demographics of the Participants of Cohort 1 (CCB) and Cohort 2 (BB) Before and After Propensity Score Matching |
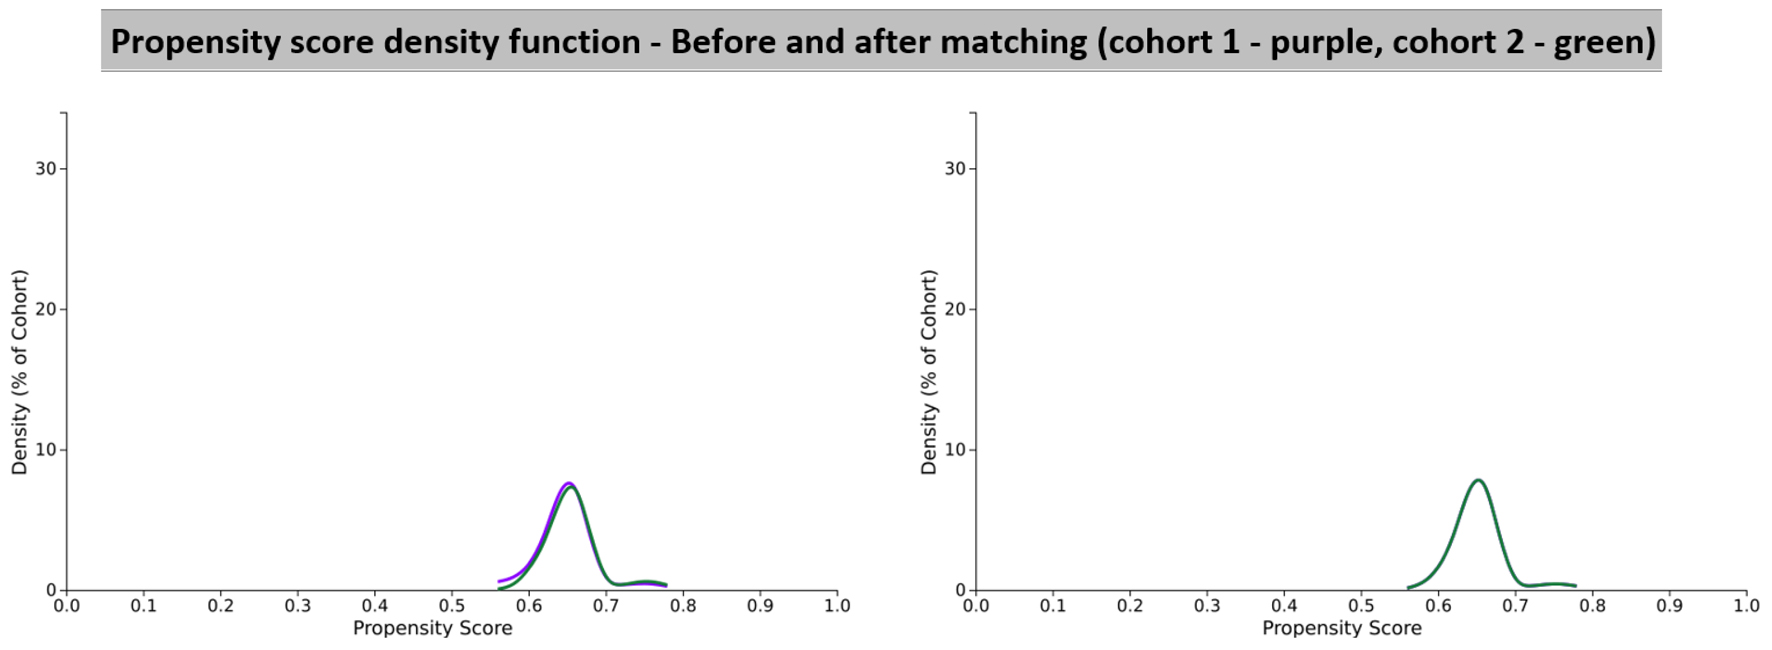 Click for large image | Figure 2. Propensity score density function graphs showing cohort 1 (CCB) and cohort 2 (BB). BB: beta-blocker; CCB: calcium channel blocker. |
For this study we also divided the current participant data into different racial groups to understand if our population study was diverse in terms of a racial profile. Table 2 depicts the segregated racial data for cohort 1 and Table 3 depicts the segregated racial data for cohort 2.
Click to view | Table 2. Racial Demographics of Participants in Cohort 1 (CCB) |
Click to view | Table 3. Racial Demographics of Participants in Cohort 2 (BB) |
The outcome tested was the diagnosis of PD (UMLS: ICD-10-CM: G20). Table 4 outlines the definitions for each outcome and the analysis specifications.
Click to view | Table 4. Outcome Diagnosis as Parkinson Disease as Well as the Settings Under Which the Different Analyses Are Run |
The TriNetX database includes several tools for data analysis, one of which is the “Measure of Association Analysis.” This tool calculates and compares the fraction of patients with the selected outcome. The output summary includes patients in each cohort (count of patients meeting query criteria); patients with outcome in each cohort (of the patients in the cohort, count of patients that had the outcome in the time window); and risk (the fraction of patients in the cohort that have the outcome in the time window, i.e. patients with outcome/patients in cohort). In addition, risk difference (the difference in the risks in cohort 1 and cohort 2), risk ratio (the ratio of the risks in cohort 1 and cohort 2), and odds ratio (the ratio of the odds in cohort 1 and cohort 2).
| Results | ▴Top |
CCB vs. BB
The first set of analyses were run to compare the outcomes of cohort 1 (CCB) vs. cohort 2 (BB). After propensity score matching, there were a total of 364,898 patients from cohort 1 (CCB) and 364,898 patients from cohort 2 as listed in Table 1. However, 1,965 patients in cohort 1 and 2,473 patients in cohort 2 were excluded from results because they had the outcome of PD prior to the time window, which started 1 day after the diagnosis of essential HTN. The risk analysis values are shown in Table 5. In cohort 1, there were 1,043 patients with an outcome of PD, which gave a risk of 0.003. In cohort 2 (BB), there were 1,420 patients with an outcome of PD, which gave a risk of 0.004. This led to a risk difference of -0.001 (95% confidence interval (CI): -0.001 to -0.001) and a P value < 0.001. The risk ratio, which is a measure of the risk of a certain event happening in one group compared to the risk of the same event happening in another group, was 0.733 (95% CI: 0.677 - 0.794) for these two cohorts. This was a statistically significant finding as there was no value of 1 in the CI. Since the risk ratio was < 1, the risk of developing PD in CCB was moderately lower than BB. Additionally, the odds ratio for this analysis was 0.733 (95% CI: 0.676 - 0.794). Once again this was a statistically significant finding as there was no value of 1 in the CI. The odds ratio also came to < 1, meaning that people with PD had more exposure to BB (control group) compared to CCB (experimental group). The hazard ratio was also calculated to compare both cohorts, which was calculated to be 0.776 (95% CI: 0.716 - 0.840). Given that there was no value of 1 value in the CI and the fact that the hazard ratio value was < 1, there was statistical significance showing an overall protective effect of CCBs over BBs in the development of PD. These results are summarized in Table 6.
Click to view | Table 5. Risk Analysis Comparing CCB (Cohort 1) vs. BB (Cohort 2 Which Is the Control) |
Click to view | Table 6. Kaplan-Meier Survival Analysis Comparing Cohort 1 (CCB) vs. Cohort 2 (BB) |
The Kaplan-Meier survival analysis values for CCB (cohort 1) and BB (cohort 2) were 96.86% and 98.27%, with PD used as the survival measure in our analysis. A log-rank test demonstrated a statistically significant difference between the survival measures of the cohorts (P < 0.001), suggesting that patients taking CCB may have a better prognosis regarding PD development. These results are summarized in Table 6 and Figure 3.
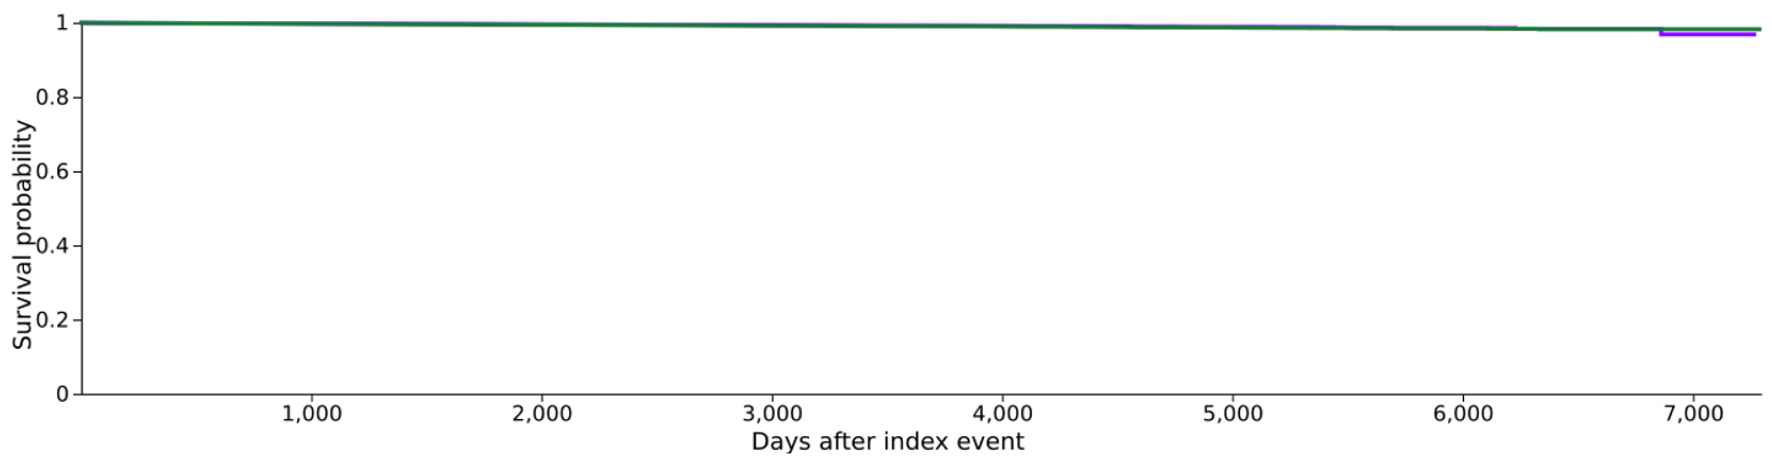 Click for large image | Figure 3. Kaplan-Meier survival graph comparing cohort 1 (CCB) vs. cohort 2 (BB). BB: beta-blocker; CCB: calcium channel blocker. |
DHP vs. non-DHP
The second set of analyses were run to compare the risk of developing PD in patients treated with DHP (cohort 3) vs. non-DHP (cohort 4). The two cohorts were defined with certain inclusion and exclusion criteria as shown in Figure 4. The patient demographics before and after propensity score matching for each group are shown in Table 7. The propensity matching curves for the cohorts are shown in Figure 5.
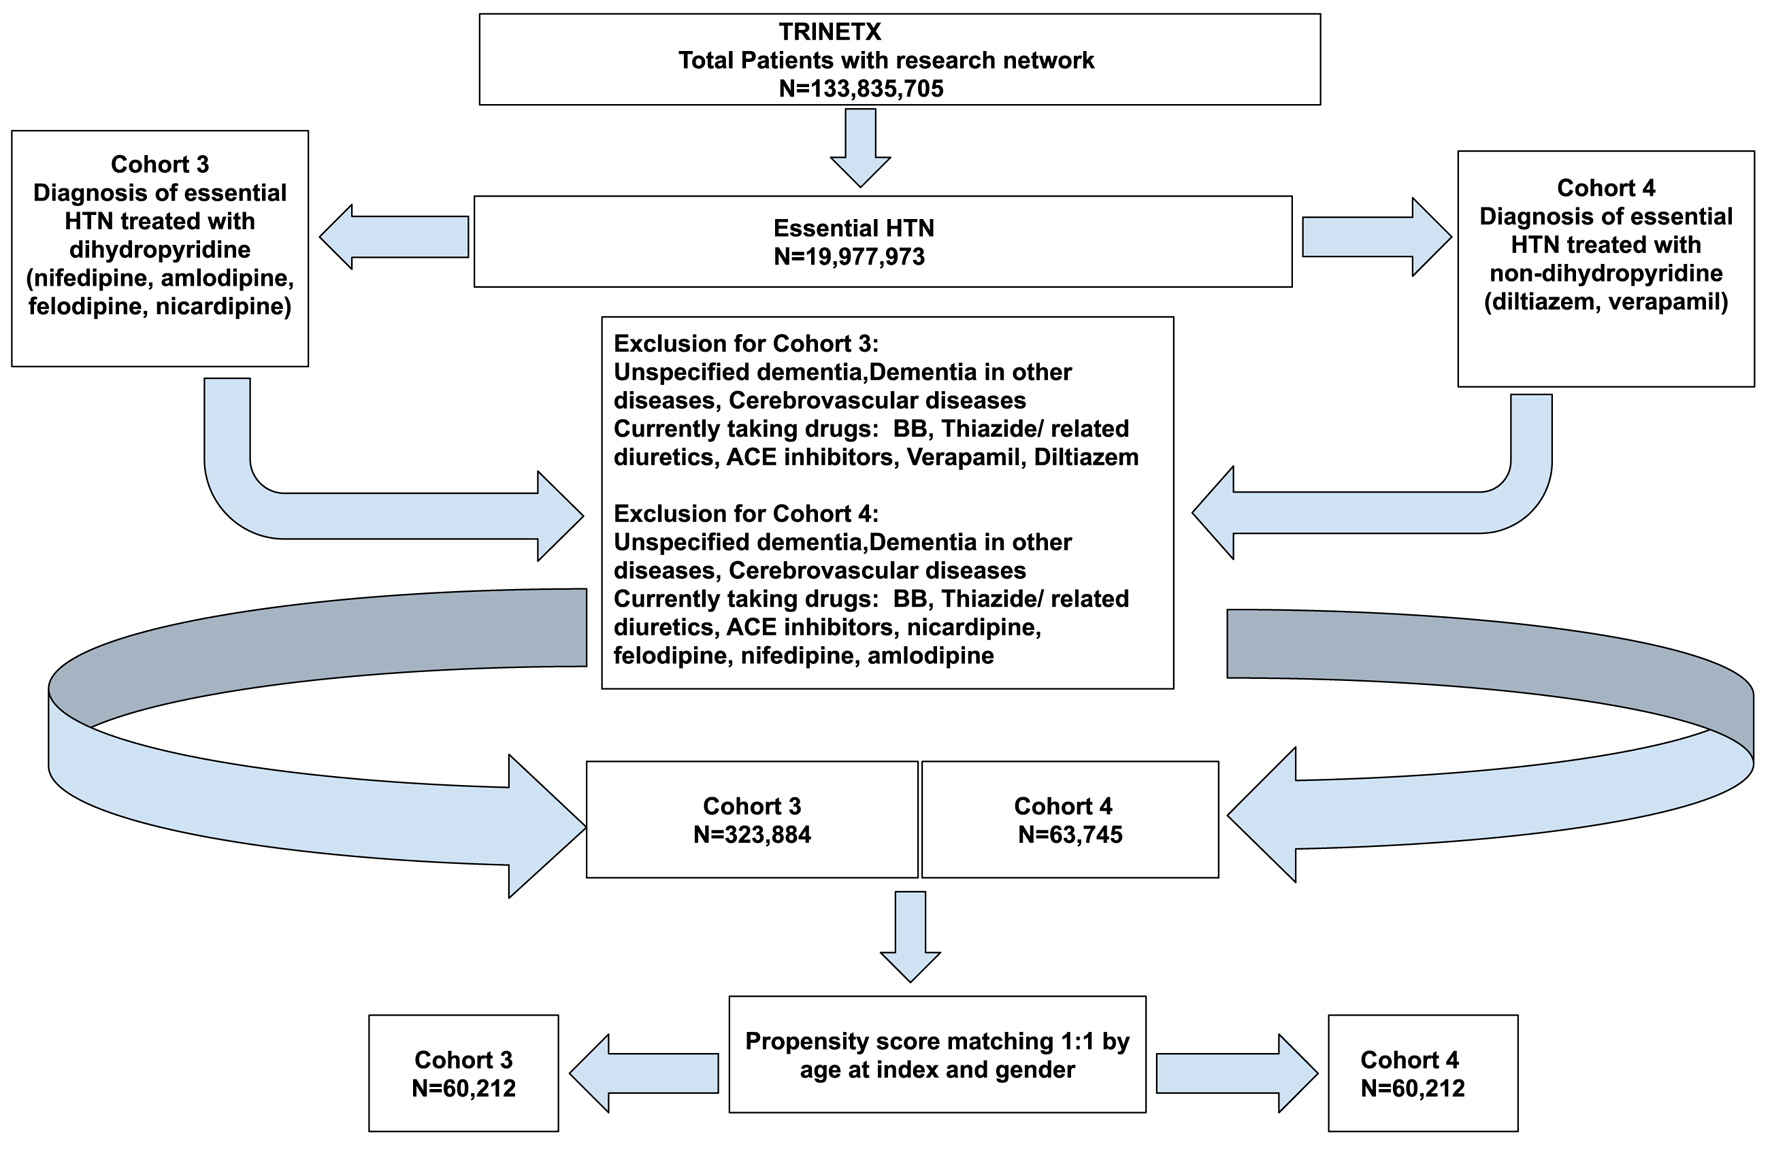 Click for large image | Figure 4. Cohort definition flowchart for cohort 3 (dihydropyridine) and cohort 4 (non-dihydropyridine). |
Click to view | Table 7. Demographics of the Participants of Cohort 3 (Dihydropyridine) and Cohort 4 (Non-Dihydropyridine) Before and After Propensity Score Matching |
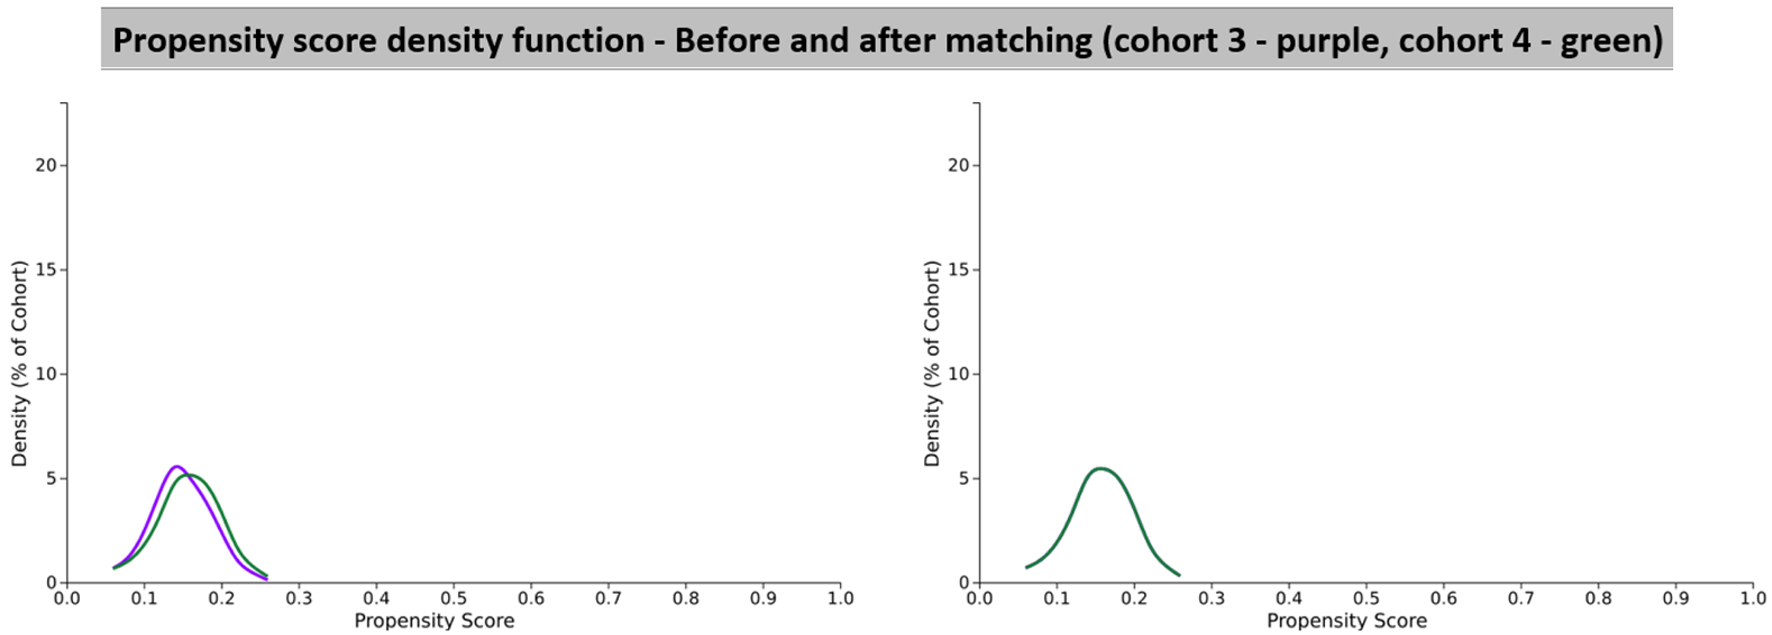 Click for large image | Figure 5. Propensity score density function graphs showing cohort 3 (dihydropyridine) and cohort 4 (non-dihydropyridine). |
After propensity score matching, there were a total of 60,212 patients from cohort 3 (DHP) and 60,212 patients from cohort 4 (non-DHP). However, 377 patients in cohort 3 (DHP) and 404 patients in cohort 4 (non-DHP) were excluded from results because they had the outcome prior to the time window. In cohort 3 (DHP), there were 203 patients with an outcome of PD out of a patient population of 59,835, which led to a risk of 0.00339. In cohort 4 (non-DHP), there were 199 patients with an outcome of PD out of a patient population of 59,808, which led to a risk of 0.00333. This gave a risk difference of 0.00006 (95% CI: -0.001 to 0.001). Since the CI had a null value, the absolute risk was not statistically significant. The risk ratio for these two cohorts was 1.020 (95% CI: 0.839 - 1.239). Since this CI included 1, this result was not statistically significant. The odds ratio for this analysis was 1.020 (95% CI: 0.838 - 1.240). Once again this was not a statistically significant finding as the CI included 1. The hazard ratio was also calculated to compare both cohorts, and this was calculated to be 0.982 (95% CI: 0.808 - 1.194). Given that there was the value of 1 in the CI, this value was not statistically significant and thus we cannot make any conclusions about the overall protective effect of DHPs vs. non-DHPs in the development of PD. These results are summarized in Table 8.
Click to view | Table 8. Risk Analysis Numbers of Analysis Set 2 Which Included People Treated With Cohort 3 (Dihydropyridine) and Cohort 4 (Non-Dihydropyridine) |
The Kaplan-Meier survival analysis values for cohort 3 (DHP) and cohort 4 (non-DHP) were 98.30% and 98.69%, with PD used as the survival measure in our analysis. However, a log-rank test demonstrated that the difference between the survival measures of the cohorts 3 + 4 (P = 0.856) was not statistically significant, suggesting that no conclusion can be made about the use of DHP regarding PD development. These results are summarized in Table 9 and Figure 6.
Click to view | Table 9. Kaplan-Meier Survival Analysis Comparing Cohort 3 (Dihydropyridine) vs. Cohort 4 (Non-Dihydropyridine) |
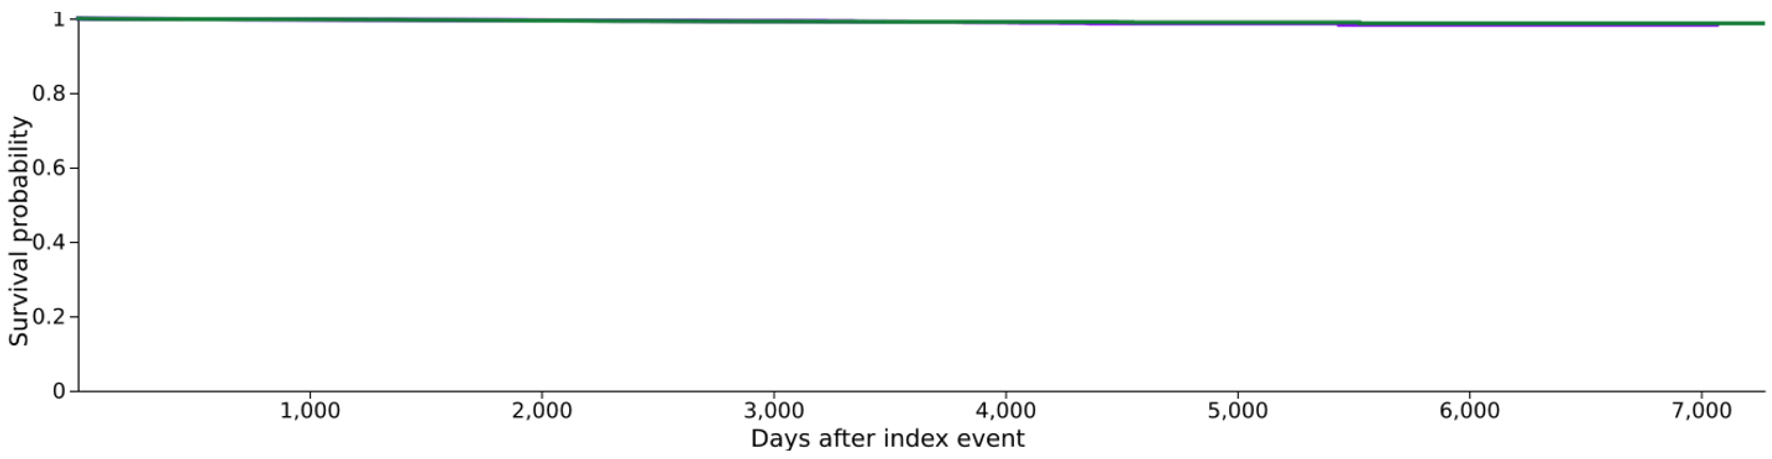 Click for large image | Figure 6. Kaplan-Meier survival graph comparing cohort 3 (dihydropyridine) vs. cohort 4 (non-dihydropyridine). |
Nifedipine vs. amlodipine
The third set of analyses were run to compare the effects of the centrally acting DHPs which cross the blood-brain barrier such as nifedipine vs. the peripherally acting DHP CCB such as amlodipine [2]. This required us to define a new set of cohorts which are outlined below in Figure 7. The patient demographics in each cohort before and after propensity score matching are given in Table 10 and the propensity score density function graphs are shown in Figure 8.
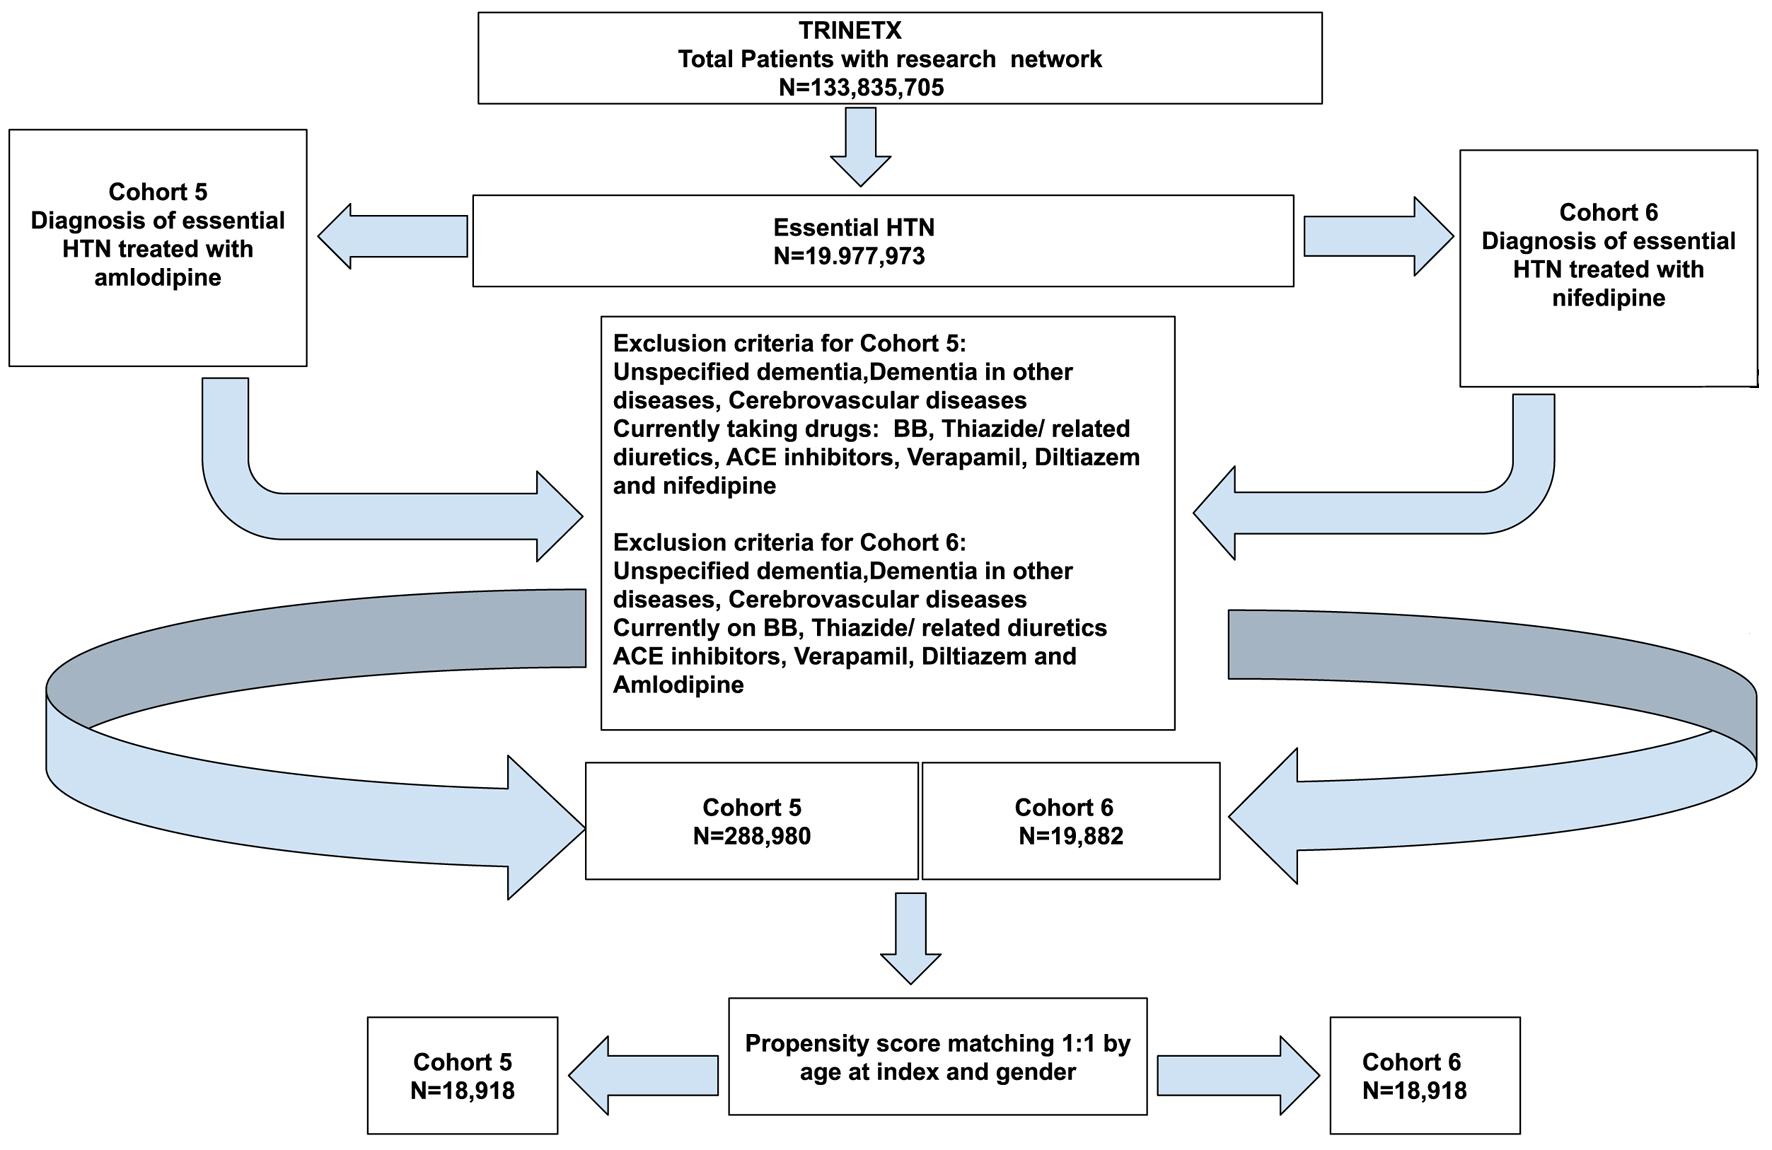 Click for large image | Figure 7. Cohort definition with the participant numbers and inclusion and exclusion criteria for cohort 5 (amlodipine) vs. cohort 6 (nifedipine). |
Click to view | Table 10. Demographics of the Participants of Cohort 5 (Amlodipine) and Cohort 6 (Nifedipine) Before and After Propensity Score Matching |
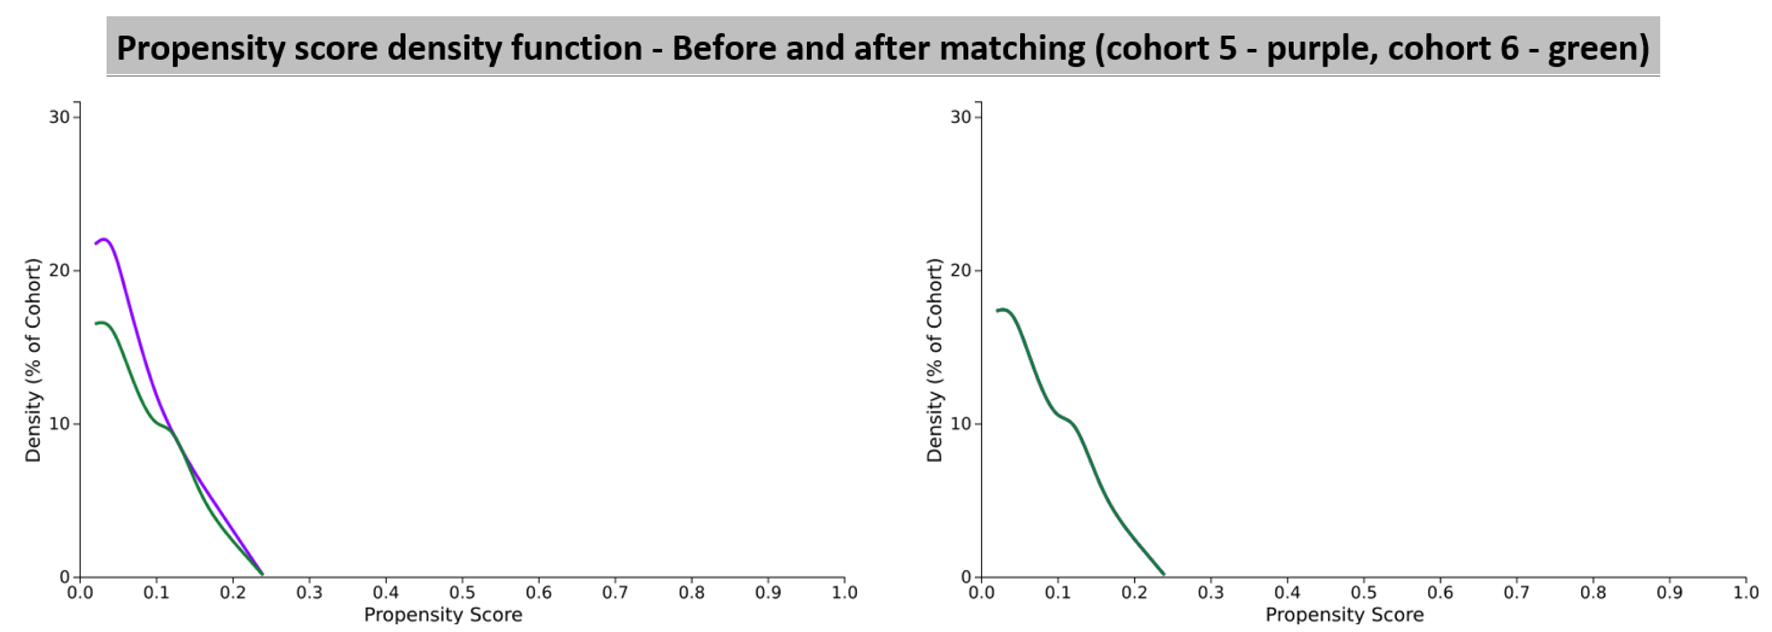 Click for large image | Figure 8. Propensity score density function graphs showing cohort 5 (amlodipine) and cohort 6 (nifedipine). |
After propensity score matching, there were a total of 18,918 patients from cohort 5 (amlodipine) and 18,918 patients from cohort 6 (nifedipine) as seen in Figure 7. However, 87 patients in cohort 5 and 92 patients in cohort 6 were excluded from results because they had the outcome prior to the time window, which started 1 day after the diagnosis of essential HTN. The risk analysis values are shown in Table 11. In cohort 5 (amlodipine), there were 36 patients with an outcome of PD out of a patient population of 18,831, which gave a risk of 0.0019. In cohort 6 (nifedipine), there were 31 patients with an outcome of PD out of a patient population of 18,826, which gave a risk of 0.0016. This gave a risk difference of 0.0003 (95% CI: -0.001 to 0.001). Unfortunately, since our numbers were very small, we could not yield a statistically significant ratio. The risk ratio for this was 1.161 (95% CI: 0.719 - 1.876). This is not a statistically significant finding as there was a value of 1 in the CI. Since the risk ratio was > 1, the risk of developing PD in patients taking nifedipine was slightly higher than amlodipine, but due to the statistical insignificance we cannot conclude this. The odds ratio for this analysis was 1.161 (95% CI: 0.718 - 1.878). Once again this was not a statistically significant finding as there was a value of 1 in the CI. The odds ratio also came to > 1, meaning that people with PD had more exposure to amlodipine compared to nifedipine, but due to the statistical insignificance we cannot conclude this. The hazard ratio was also calculated to compare both cohorts which was calculated to be 1.109 (95% CI: 0.686 - 1.793). As expected, this ratio was not statistically significant as the CI included value of 1. These results are summarized in Table 11.
Click to view | Table 11. Risk Analysis Numbers of Analysis Set 2 Which Included People Treated With Cohort 5 (Amlodipine) vs. Cohort 6 (Nifedipine) |
The Kaplan-Meier survival analysis values for cohort 5 (amlodipine) and cohort 6 (nifedipine) were 99.71% and 98.74%, with PD used as the survival measure in our analysis. However, a log-rank test demonstrated that the difference between the survival measures of the cohorts 5 and 6 (P = 0.672) was not statistically significant, indicating that neither group provides a significant benefit over the other in terms of developing PD. These results are summarized in Table 12 and Figure 9.
Click to view | Table 12. Kaplan-Meier Survival Analysis Comparing Cohort 5 (Amlodipine) vs. Cohort 6 (Nifedipine) |
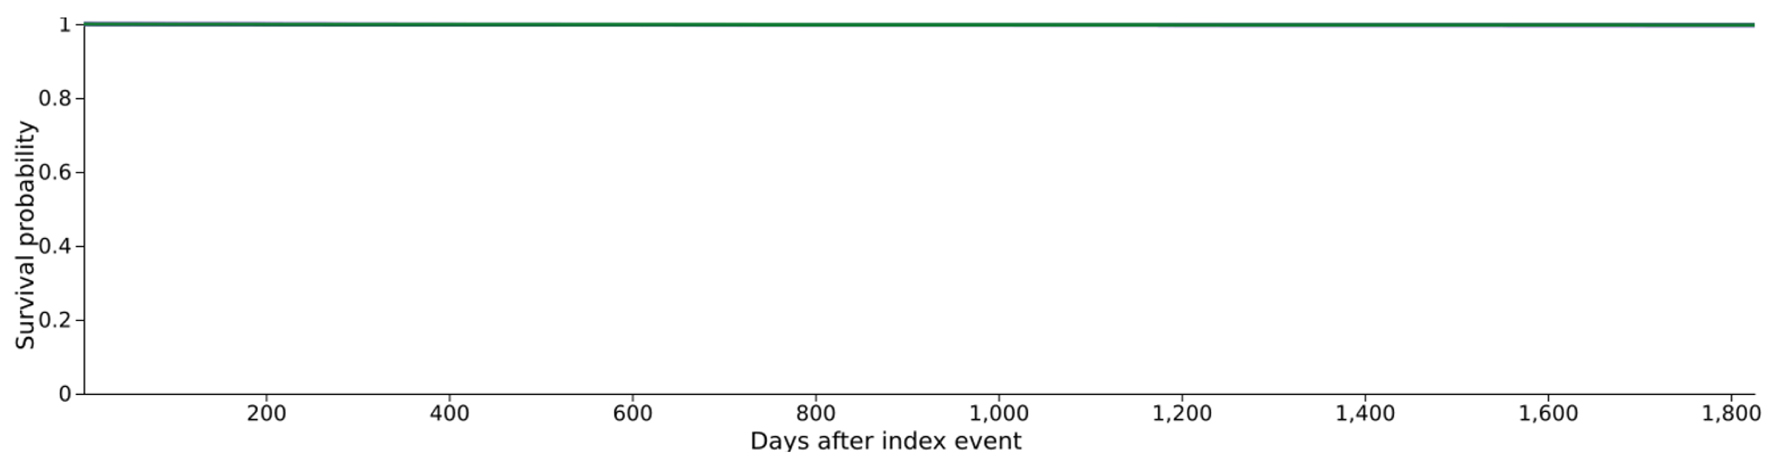 Click for large image | Figure 9. Kaplan-Meier survival graph comparing cohort 5 (amlodipine) vs. cohort 6 (nifedipine). |
| Discussion | ▴Top |
The findings from this study suggest that the risk of developing PD is lower in patients treated with CCBs compared to those treated with BBs. Although no significant differences were observed between treatment with DHPs and non-DHPs, or between specific drugs such as amlodipine and nifedipine, this suggests that the subclass or specific agent within the CCB class may not significantly alter the risk of PD in patients with HTN. This finding implies that the overall class effect of CCBs may be more relevant than the choice of a particular CCB.
While the exact mechanisms underlying the potential neuroprotective effects of CCBs remain unclear, a plausible theory involves a two-fold action: controlling HTN and preventing calcium ion-induced cytotoxicity to DA neurons. As discussed earlier, persistent HTN may contribute to infarcts in critical regions like the basal ganglia, disrupting DA cells and neural networks, and ultimately leading to cerebrovascular dysfunction [11]. Furthermore, pre-existing HTN itself has been identified as a risk factor for PD diagnosis, as shown in the meta-analysis by Hou et al [1]. In addition, in vitro evidence suggests that with advanced age, DA neurons increasingly rely on L-type Cav1.3 calcium channels, which may accelerate neurodegeneration [11].
Despite these theories, studies examining the relationship between CCB use and PD incidence have produced inconsistent results [4, 8]. While researches by Ritz et al and Lee et al suggested that long-term use of centrally acting DHP CCBs may lower the risk of developing PD, Marras et al found no evidence that brain-penetrant DHPs significantly impact PD progression at standard antihypertensive doses [2, 7, 12]. These contrasting findings underscore the need for further research to clarify the neuroprotective potential of CCBs, particularly regarding their effects on both the incidence and progression of PD. Ultimately, the mechanisms behind these observations remain speculative and warrant further investigation through in vitro and animal studies.
Given that chronic conditions such as HTN disproportionately affect racial and ethnic groups like African American and Latino populations compared to Caucasians [13], it is crucial to consider racial disparities when discussing HTN-related long-term outcomes. Previous studies examining the link between ethnicity and PD development in individuals with a history of HTN have identified a significantly increased risk of PD in Asians compared to Caucasians [1]. While the exact reasons for this association remain unclear, they may involve genetic and environmental factors that predispose certain populations to HTN. However, research exploring the relationship between HTN and PD risk in African American and Hispanic/Latino populations remains limited [14], highlighting the need for further studies in these groups. A major strength of our study is that it is the first in the United States to examine the potential neuroprotective effects of CCBs against PD. This work lays the foundation for future research exploring how these effects may vary across different racial and ethnic groups, considering the influence of diverse genetic and environmental factors.
Limitations
There are several limitations to our study, primarily due to its retrospective cohort design and reliance on an EHR database. While the TriNetX platform provides access to a large, diverse, real-world dataset, it has inherent challenges. Data quality depends on routine clinical documentation, which can lead to incomplete, inaccurate, or inconsistent information. Additionally, key confounding variables, such as lifestyle factors, disease severity, medication adherence, and family history, are often missing or underreported. The lack of access to individual-level data also limits our ability to perform detailed analyses, confirm findings, or adjust for unmeasured confounders. Another limitation is the unequal distribution of racial groups in our study population, which reflects disparities in healthcare access and trust among minority populations, leading to underrepresentation in datasets like TriNetX.
Furthermore, we could not reliably monitor medication adherence, nor exclude the possibility that some patients may have had subclinical PD prior to the study period, which could result in misclassification. Other potential confounders, such as smoking, substance use, diet, physical activity, and genetic factors, were not controlled for during propensity score matching, which may have led to an over- or underestimation of the treatment effect depending on the direction and magnitude of residual confounding.
In conclusion, while our findings suggest a potential neuroprotective effect of CCBs against PD, further long-term, population-based studies are necessary to confirm these results and to explore the complex interplay of additional risk factors in PD development.
| Supplementary Material | ▴Top |
Suppl 1. TriNetX Query Logic as Well as the Analysis Basics With Specified Cohort Data for Each Set of Analyses.
Acknowledgments
None to declare.
Financial Disclosure
None to declare.
Conflict of Interest
The authors declare that there are no financial, personal, or professional conflicts of interest that could have influenced the content, results, or conclusions of this study.
Informed Consent
This retrospective study is exempt from informed consent.
Author Contributions
Dr. Ahmed Ali: conceptualization, data curation, formal analysis, methodology, project administration, visualization, writing - original draft, writing - review and editing, resources, software, supervision, validation, and funding. Dr. Miriam Michael: conceptualization, data curation, formal analysis, methodology, project administration, visualization, writing - original draft, writing - review and editing, resources, software, supervision, and validation. Shivani Waghmare: conceptualization, data curation, formal analysis, methodology, writing - original draft, and writing - review and editing. Samrawit Zinabu: conceptualization, data curation, formal analysis, funding acquisition, methodology, project administration, visualization, writing - original draft, writing - review and editing, investigation, resources, software, supervision, and validation. Christian Wong, Noah Wheaton, Tabitha Norton, Tia Tyson, Jerome Watts, Peyton Smith, and Girma Ayele: data curation, methodology, writing - original draft, and writing - review and editing.
Data Availability
The authors declare that data supporting the findings of this study are available within the article and its supplementary information files.
| References | ▴Top |
- Hou L, Li Q, Jiang L, Qiu H, Geng C, Hong JS, Li H, et al. Hypertension and diagnosis of Parkinson's disease: a meta-analysis of cohort studies. Front Neurol. 2018;9:162.
doi pubmed - Lee YC, Lin CH, Wu RM, Lin JW, Chang CH, Lai MS. Antihypertensive agents and risk of Parkinson's disease: a nationwide cohort study. PLoS One. 2014;9(6):e98961.
doi pubmed - Li HJ, Yu Y, Chen Y, Liang HY. Vascular risk factors aggravate the progression of Parkinson's disease: a five-year follow-up study in Chinese patients. Int J Clin Exp Med. 2015;8(6):9897-9903.
pubmed - Zaichick SV, McGrath KM, Caraveo G. The role of Ca(2+) signaling in Parkinson's disease. Dis Model Mech. 2017;10(5):519-535.
doi pubmed - CaV1.3-selective L-type calcium channel antagonists as potential new therapeutics for Parkinson’s disease | Nature Communications. Accessed May 21, 2025. https://www.nature.com/articles/ncomms2149.
- Alam MR, Raj K, Singh S. The roles of calcium ions in Parkinson’s disease: calcium channel inhibitors as a novel agents? Journal of Molecular Pathology. 2022;3(4):243-261.
doi - Ritz B, Rhodes SL, Qian L, Schernhammer E, Olsen JH, Friis S. L-type calcium channel blockers and Parkinson disease in Denmark. Ann Neurol. 2010;67(5):600-606.
doi pubmed - Lin J, Pang D, Li C, Ou R, Yu Y, Cui Y, Huang J, et al. Calcium channel blockers and Parkinson's disease: a systematic review and meta-analysis. Ther Adv Neurol Disord. 2024;17:17562864241252713.
doi pubmed - Wiysonge CS, Volmink J, Opie LH. Beta-blockers and the treatment of hypertension: it is time to move on. Cardiovasc J Afr. 2007;18(6):351-352.
pubmed - Ton TG, Heckbert SR, Longstreth WT, Jr., Rossing MA, Kukull WA, Franklin GM, Swanson PD, et al. Calcium channel blockers and beta-blockers in relation to Parkinson's disease. Parkinsonism Relat Disord. 2007;13(3):165-169.
doi pubmed - Ng YF, Ng E, Lim EW, Prakash KM, Tan LCS, Tan EK. Case-control study of hypertension and Parkinson's disease. NPJ Parkinsons Dis. 2021;7(1):63.
doi pubmed - Marras C, Gruneir A, Rochon P, Wang X, Anderson G, Brotchie J, Bell CM, et al. Dihydropyridine calcium channel blockers and the progression of parkinsonism. Ann Neurol. 2012;71(3):362-369.
doi pubmed - Lackland DT. Racial differences in hypertension: implications for high blood pressure management. Am J Med Sci. 2014;348(2):135-138.
doi pubmed - Bailey M, Anderson S, Hall DA. Parkinson's disease in African Americans: a review of the current literature. J Parkinsons Dis. 2020;10(3):831-841.
doi pubmed
This article is distributed under the terms of the Creative Commons Attribution Non-Commercial 4.0 International License, which permits unrestricted non-commercial use, distribution, and reproduction in any medium, provided the original work is properly cited.
Journal of Neurology Research is published by Elmer Press Inc.