| Journal of Neurology Research, ISSN 1923-2845 print, 1923-2853 online, Open Access |
| Article copyright, the authors; Journal compilation copyright, J Neurol Res and Elmer Press Inc |
| Journal website https://jnr.elmerpub.com |
Original Article
Volume 16, Number 2, June 2026, pages 88-98

Comparison of Diffusion Tensor Imaging Parameters Associated With Motor Fiber Injury Between Patients With Chronic Subdural Hematoma and Intracerebral Hemorrhage
Takumi Yokohamaa, d, Motoyuki Iwasakib, Daisuke Ouraa, Yoshimasa Niiyac
aDepartment of Radiology, Otaru General Hospital, Otaru, Hokkaido, Japan
bDepartment of Neurosurgery, Hokkaido University Hospital, Sapporo, Hokkaido, Japan
cDepartment of Neurosurgery, Otaru General Hospital, Otaru, Hokkaido, Japan
dCorresponding Author: Takumi Yokohama, Department of Radiology, Otaru General Hospital, Wakamatsu 1-1-1, Otaru, Hokkaido 047-8550, Japan
Manuscript submitted December 12, 2025, accepted March 30, 2026, published online May 4, 2026
Short title: Motor Fiber Injury in CSDH and ICH: A DTI Comparison
doi: https://doi.org/10.14740/jnr1086
| Abstract | ▴Top |
Background: Most patients with chronic subdural hematoma (CSDH) show remarkable recovery from paralysis after surgery, while patients with intracerebral hemorrhage (ICH) often suffer from residual motor deficits. The mechanisms underlying this discrepancy remain unclear.
Methods: We hypothesized that differences in corticospinal tract integrity could explain the divergent outcomes and therefore investigated quantitative diffusion tensor imaging (DTI) parameters in both groups. Fractional anisotropy (FA) and apparent diffusion coefficient (ADC) values were measured along the pyramidal tract, and results were correlated with clinical outcomes assessed by the modified Rankin scale (mRS).
Results: Patients with ICH demonstrated significantly lower FA values, indicating substantial pyramidal tract disruption, whereas those with CSDH showed no significant FA reduction. The CSDH group exhibited significant functional improvement between onset and discharge, with 70% achieving favorable outcomes (mRS 0–2) compared with only 18% in the ICH group. A negative correlation was observed between FA values and mRS across all patients, suggesting that structural integrity of the corticospinal tract strongly influences prognosis.
Conclusion: These results imply that, unlike ICH, CSDH does not generally cause irreversible tract damage, which may contribute to the rapid improvement of postoperative paralysis. Our findings highlight the value of DTI parameters for assessing motor fiber injury and prognosis in hemorrhagic brain diseases. Furthermore, this study emphasizes that surgical decompression for CSDH may allow functional recovery by preserving white matter integrity, whereas ICH is associated with more severe and permanent tract injury. DTI-based evaluation may therefore provide an imaging biomarker for differentiating recovery potential.
Keywords: Apparent diffusion coefficient; Chronic subdural hematoma; Diffusion tensor imaging; Fractional anisotropy; Intracerebral hemorrhage; Prognosis
| Introduction | ▴Top |
Magnetic resonance imaging (MRI) with diffusion tensor imaging (DTI) is a powerful tool for evaluating white matter integrity [1–3]. Fractional anisotropy (FA) and apparent diffusion coefficient (ADC) are key parameters for quantifying microstructural changes in the corticospinal tract (CST). While DTI has been widely used to assess neuronal injury in various cerebrovascular diseases, the specific differences in CST damage between chronic subdural hematoma (CSDH) and intracerebral hemorrhage (ICH) remain insufficiently characterized [4–6].
CSDH is often associated with rapid clinical recovery after surgical drainage, suggesting that the underlying motor fiber injury may be reversible. In contrast, ICH typically results in more persistent motor deficits, often reflecting irreversible axonal destruction or secondary degeneration, which is consistent with findings from previous CST studies [6, 7]. However, it is unclear whether these clinical differences are directly reflected in DTI parameters when considering confounding factors such as age, lesion location, or hematoma volume. Understanding these microstructural distinctions is crucial for predicting prognosis and optimizing therapeutic strategies.
In this study, we aimed to compare DTI parameters of the CST between patients with CSDH and ICH. Furthermore, we employed multivariable linear regression analysis to determine whether the observed differences in FA values were independently driven by the disease type, rather than demographic or clinical confounders. We hypothesized that the CST integrity is relatively preserved in CSDH compared to ICH, reflecting the reversible nature of the associated motor impairment.
| Materials and Methods | ▴Top |
Participants
A total of 140 patients were investigated between April 2020 and April 2022, with 81 meeting the inclusion criteria. The criteria required patients to have only the specified condition without other cerebrovascular diseases. Patients with contralateral paralysis due to midline shift were excluded, and only those with unilateral paralysis were included. This study was conducted after approval by the Institutional Review Board (IRB) of Otaru General Hospital (IRB Approval 05-025). This study was conducted in compliance with the ethical standards of the responsible institution on human subjects as well as with the Helsinki Declaration.
The experimental group consisted of 40 patients with CSDH (49%) and 41 with ICH (51%). The CSDH group ranged in age from 54 to 96 years (mean 79.3 ± 5.81 years; 28 men and 12 women), and the ICH group ranged from 36 to 93 years (mean 72.0 ± 12.9 years; 22 men and 21 women). Among patients with ICH, hemorrhage locations were as follows: 15 putaminal, 11 thalamic, 13 subcortical, one cerebellar, and one pontine hemorrhage. MRI was performed preoperatively (at the time of bleeding, examination on the day of surgery) and postoperatively (on the day after surgery) in both patient groups. Eleven healthy controls aged 29–57 years (mean 38.8 ± 9.52 years; seven men and four women) were also included for comparison.
MRI
Preoperative and postoperative FA and ADC values of the CST were compared using a 3-T MR scanner (Ingenia, Koninklijke Philips N.V., Amsterdam, Netherlands) with a 32-channel head coil.
Imaging protocol and parameters
DTI parameters were as follows: repetition time (TR) = 3,000 ms; echo time (TE) = 81 ms; matrix = 76 × 73; number of sample averages (NSA) = 1; scan time = 1 min 08 s; single-shot spin echo (SE); b-value = 1,500 s/mm2; six motion-probing gradient (MPG) directions; field of view = 230 × 230 mm2; slice thickness = 3 mm; number of slices = 50.
Evaluation and analysis
The FA map was calculated from DTI, and the FA and ADC values of the CST were measured bilaterally in each patient. Regions of interest (ROIs) were carefully placed to avoid direct inclusion of the hematoma. However, perilesional edema could not always be excluded, especially in ICH patients, and may have influenced the measured DTI parameters. In ICH cases, imaging was performed within 24 h of symptom onset to capture early-phase changes, while in CSDH cases, pre- and postoperative scans were performed with an interval of 3 to 7 days depending on surgical timing and clinical stability.
In the lesion group, measurements from the affected and unaffected sides were compared. In the control group, values from the left and right hemispheres were used as normal for comparison. All measurements were performed by radiologic technologists with over 10 years of experience.
DTI data were analyzed using a built-in console with a tensor fitting algorithm based on least-squares optimization. The data were preprocessed with motion correction and eddy current distortion correction.
Tractography was performed using a deterministic streamline algorithm (fiber assignment by continuous tracking) implemented in the Philips DTI console. Fiber tracking was terminated at a minimum FA of 0.15, with a maximum turning-angle threshold of 27° and a minimum fiber length of 20 mm. The angle threshold of 27° corresponds to the vendor-supplied default setting in the Philips platform, which is widely adopted in clinical deterministic tractography protocols. Although reported angle thresholds in the literature vary across studies (typically ranging from 30° to 45°), the use of a standardized, manufacturer-defined threshold improves methodological reproducibility and minimizes user-dependent variability [8, 9]. This approach is therefore appropriate for ensuring consistent CST reconstruction across subjects.
ROIs were manually placed at three anatomical landmarks: the precentral gyrus (motor cortex), the posterior limb of the internal capsule (PLIC), and the cerebral peduncle. These ROIs were selected based on known anatomical pathways of the CST [10] (Fig. 1). In this study, “subcortical” refers specifically to the subcortical white matter beneath the motor cortex and does not include subcortical nuclei such as the basal ganglia or thalamus.
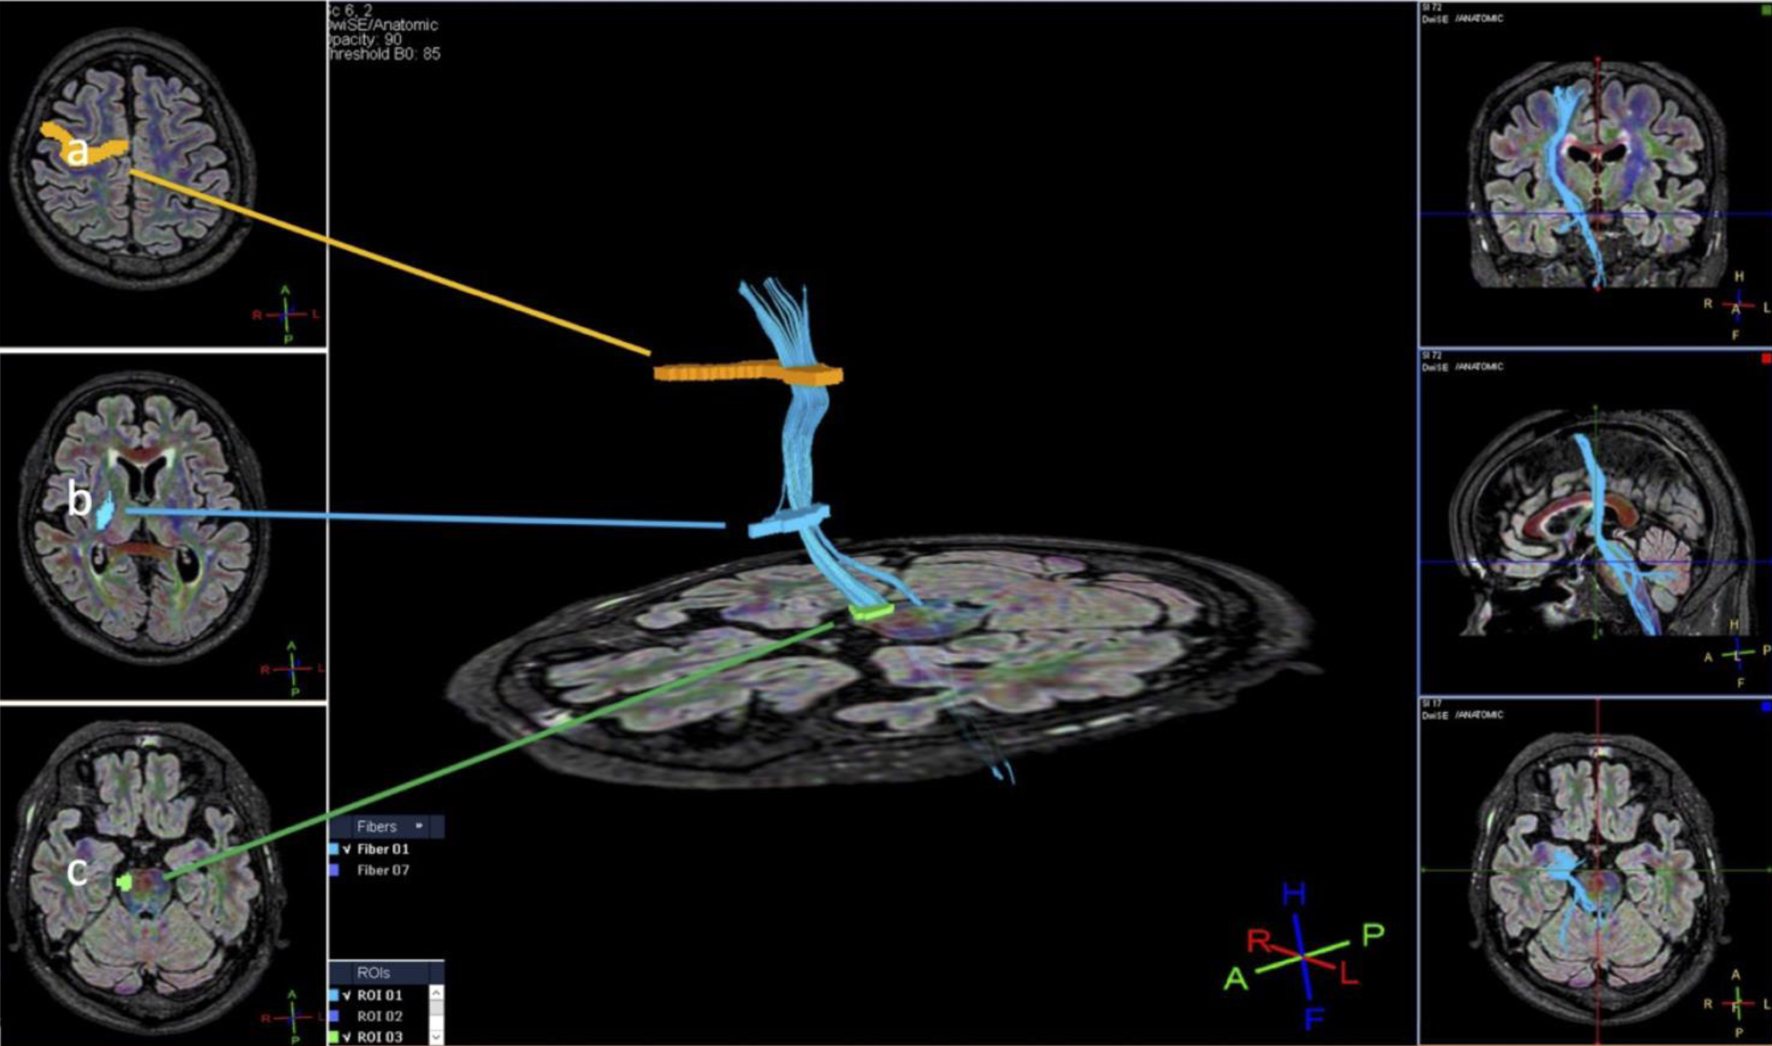 Click for large image | Figure 1. Method for setting the region of interest (ROI): (a) precentral gyrus; (b) posterior limb of the internal capsule; (c) cerebral peduncle. |
The cerebral peduncle served as the seed ROI, the precentral gyrus as the target ROI, and the PLIC as the intermediate ROI. In cases where extraneous fibers were visualized despite using this three-point ROI method, the ROI size and placement were adjusted to minimize inclusion of non-CST fibers. We did not employ exclusion (NOT) ROIs to maintain consistency and reproducibility in a clinical setting.
To minimize operator-dependent bias in ROI placement and tract reconstruction, two radiologic technologists with more than 10 years of experience in neuroimaging independently performed the tractography procedures. Each rater placed the ROIs manually based on the standardized anatomical landmarks described above, without access to clinical outcome data or group allocation. In each case, tractography was repeated three times, and the reconstruction showing the most anatomically appropriate depiction of the CST was selected for analysis. This approach was intended to enhance consistency and reproducibility while reflecting practical clinical workflow.
We also evaluated hematoma volume on CT scans performed from the onset of symptoms to the day of surgery in patients with ICH. The CT slice with the largest hemorrhage area on admission to the acute-care hospital was identified. The largest diameter (A) of the hemorrhage and the diameter perpendicular to A (B) on the same slice were measured. Finally, the approximate number of 3-mm slices on which the ICH was seen was determined to calculate the height (C). Hematoma volume was calculated as follows: major axis (A) × minor axis (B) × height (C) × 1/2 (mL) [11].
Furthermore, modified Rankin scale (mRS) scores at onset and at discharge were compared. Statistical analyses were performed using JMP version 12 (SAS Institute Inc., Cary, NC, USA). For comparisons of continuous, normally distributed data such as FA values, the unpaired t-test or paired t-test was used as appropriate. For non-normally distributed data such as ADC values or ordinal data such as mRS scores, the Mann–Whitney U test was applied. The Tukey–Kramer method was used for multiple group comparisons. To evaluate the independent effect of the disease type on FA values, a multivariable linear regression analysis was performed for the entire cohort, including group (CSDH vs. ICH), age, lesion location, ADC, mRS at onset, and mRS at discharge as independent variables. Additionally, within the ICH group, a separate multivariable linear regression was conducted to adjust for age and hematoma volume.
Box plots were constructed using five-number summaries: minimum, 25th percentile (Q1), median, 75th percentile (Q3), and maximum. The box spans from Q1 to Q3 with a line at the median. The upper whisker represents the difference between the maximum and Q3, and the lower whisker represents the difference between Q1 and the minimum value. A P-value of < 0.05 was considered statistically significant.
The single measure intraclass correlation coefficient (ICC) was used to evaluate inter-rater reliability using the following criteria: < 0.40 = poor agreement; 0.40 to 0.59 = fair agreement; 0.60 to 0.74 = good agreement; 0.75 to 1.00 = excellent agreement.
The ICC was calculated as follows:
| Results | ▴Top |
Measurements in patients with CSDH
FA and ADC values obtained from DTI are shown in Table 1. We excluded seven patients with bilateral CSDH and four with CSDH owing to motion artifact. In the lesion hemisphere, the mean FA and ADC values for pre-surgery CSDH were 0.552 ± 0.0450 and 0.710 ± 0.0789, respectively, and post-surgery values 0.539 ± 0.0255 and 0.708 ± 0.0377, respectively.
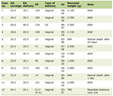 Click to view | Table 1. The FA and ADC Values Pre- and Post-Surgery in Patients With CSDH (ADC: × 10-3 mm2/s) |
In the normal hemisphere, the mean FA and ADC values for pre-surgery CSDH were 0.545 ± 0.0363 and 0.732 ± 0.0684, respectively, and post-surgery values were 0.533 ± 0.0181 and 0.735 ± 0.0519, respectively. No significant difference was observed in FA and ADC values between the lesion and normal hemispheres pre-surgery. Furthermore, there was no significant difference in FA and ADC values in the lesion hemisphere between pre- and post-surgery (Fig. 2).
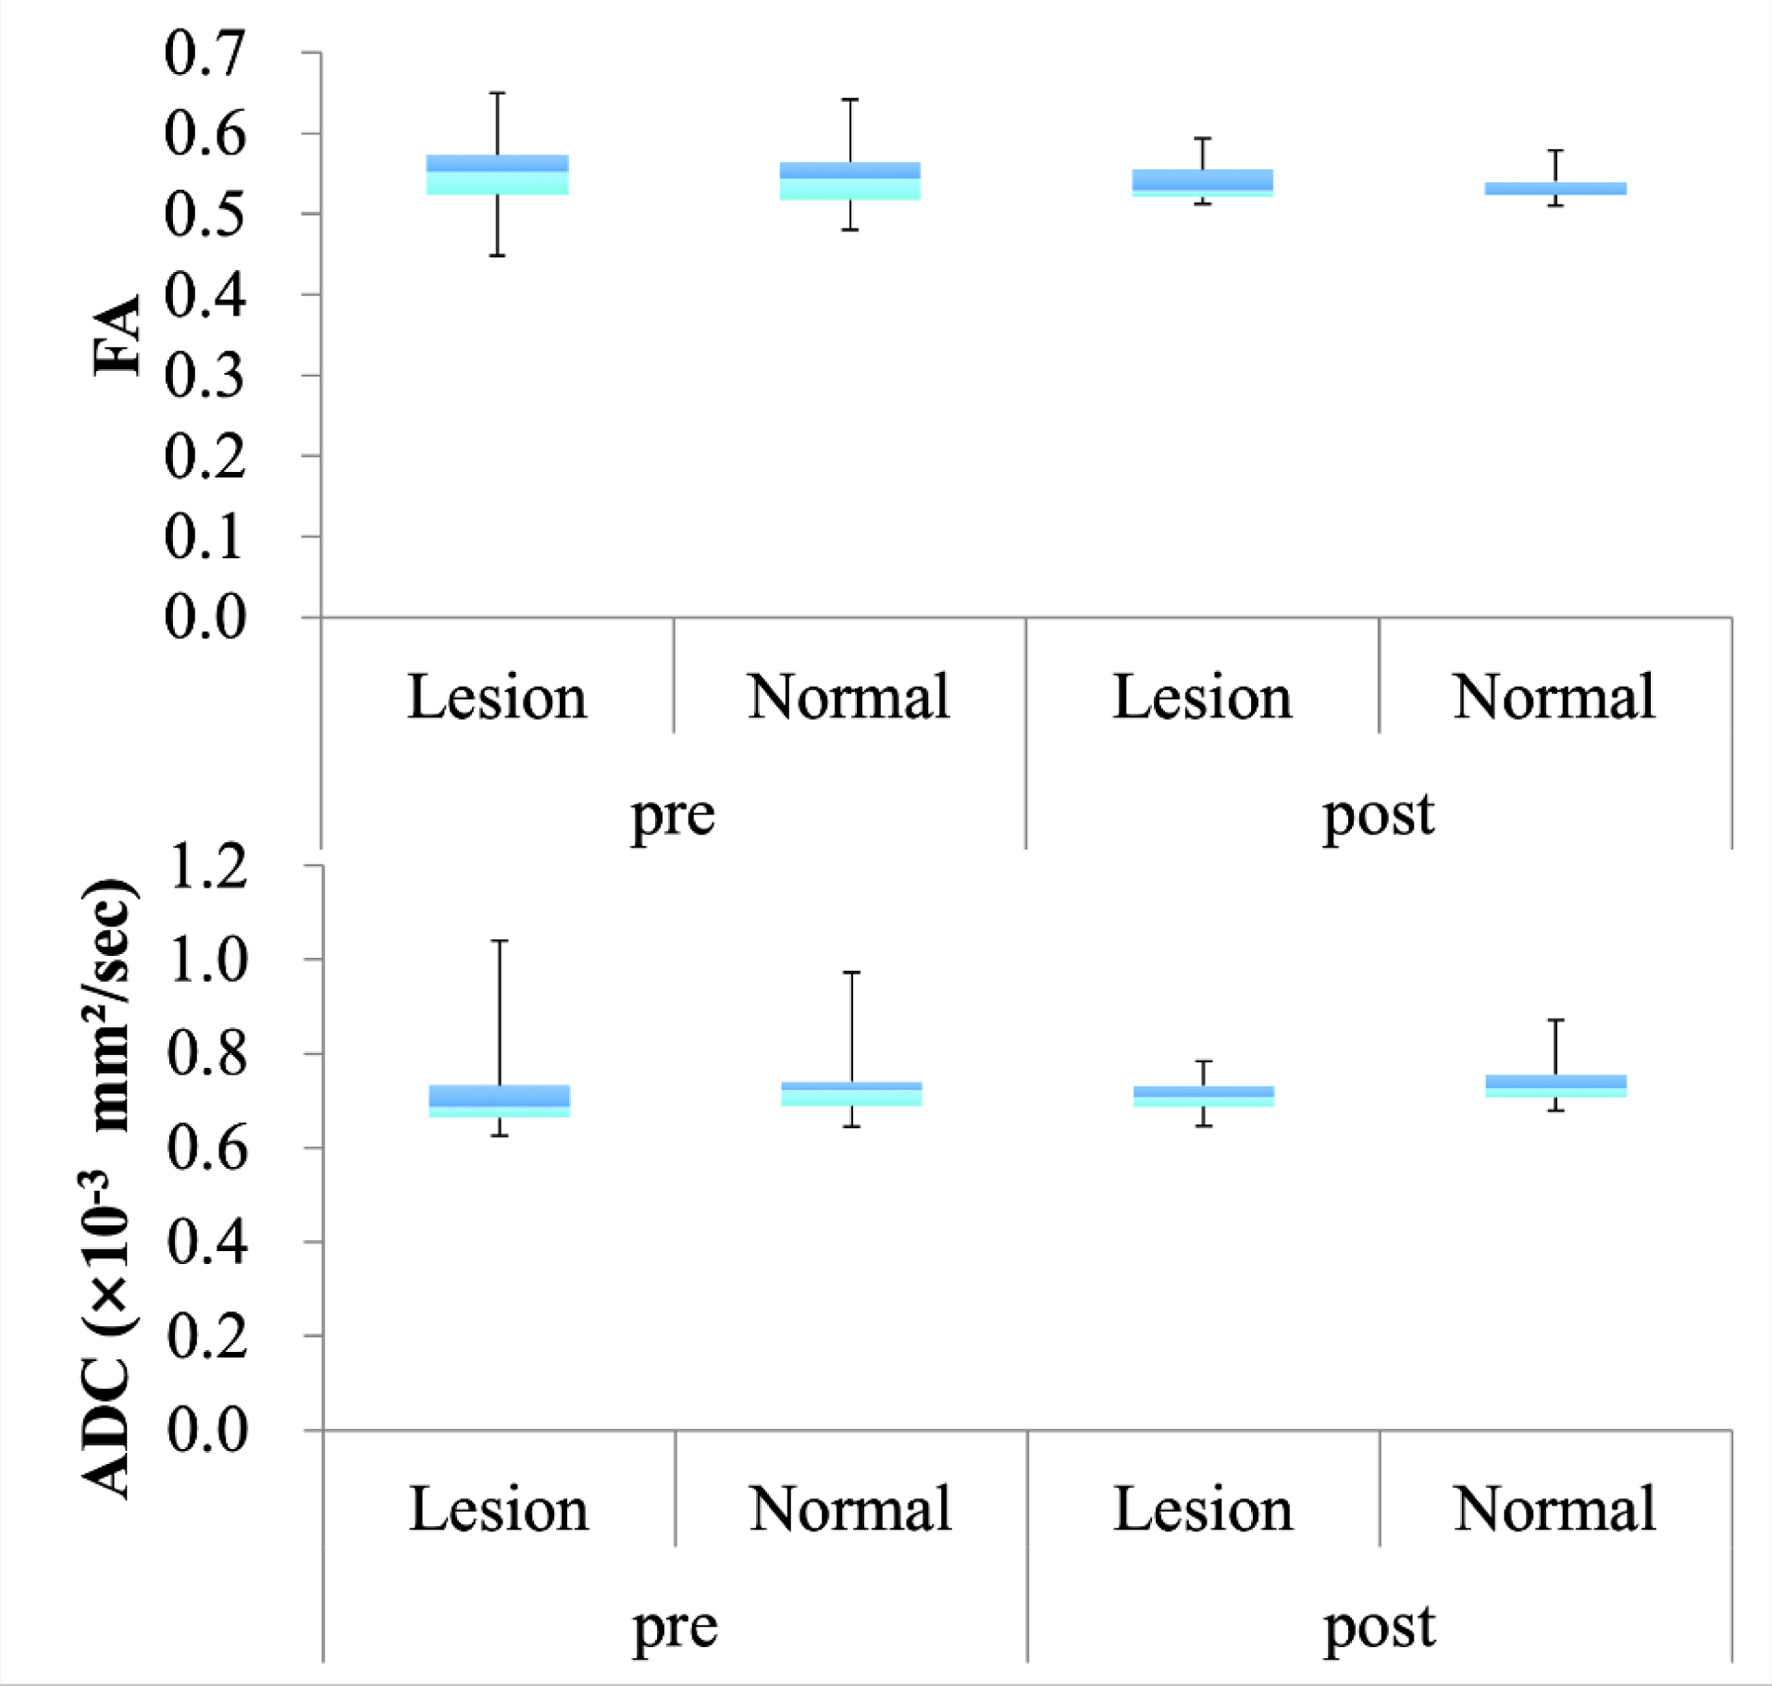 Click for large image | Figure 2. Comparative fractional anisotropy (FA) and apparent diffusion coefficient (ADC) values between the lesion and normal hemisphere in patients with chronic subdural hematoma (CSDH). |
Measurements in patients with ICH
The FA and ADC values obtained from DTI are shown in Table 2. We excluded data from four patients with ICH from the analysis owing to motion artifacts. In addition, cases of brainstem and cerebellar hemorrhage were excluded because there was only one case for each location, making them unsuitable for statistical comparison. In the lesion hemisphere, mean FA and ADC values were 0.506 ± 0.0321 and 0.753 ± 0.0903, respectively, for putaminal hemorrhage; 0.539 ± 0.0310 and 0.682 ± 0.0796, respectively, for subcortical hemorrhage; and 0.523 ± 0.0301 and 0.738 ± 0.0536, respectively, for thalamic hemorrhage.
Click to view | Table 2. Comparison of DTI Parameters According to ICH Lesion Location (ADC: × 10-3 mm2/s) |
In the normal hemisphere, the mean FA and ADC values were 0.526 ± 0.0306 and 0.805 ± 0.0695, respectively, for putaminal hemorrhage; 0.539 ± 0.0317 and 0.741 ± 0.0735, respectively, for subcortical hemorrhage; and 0.528 ± 0.0367 and 0.753 ± 0.0642, respectively, for thalamic hemorrhage. For putaminal hemorrhage, there was a significant difference in FA and ADC values between the lesion and normal hemisphere (P < 0.05, P < 0.01; Fig. 3). For subcortical hemorrhage, a significant difference in ADC values (P < 0.01) was observed, whereas for thalamic hemorrhage, no significant difference was noted between the lesion and normal hemispheres. Overall, there was a significant difference in FA and ADC values between the lesion and normal hemisphere in all patients with ICH (P < 0.05, P < 0.001).
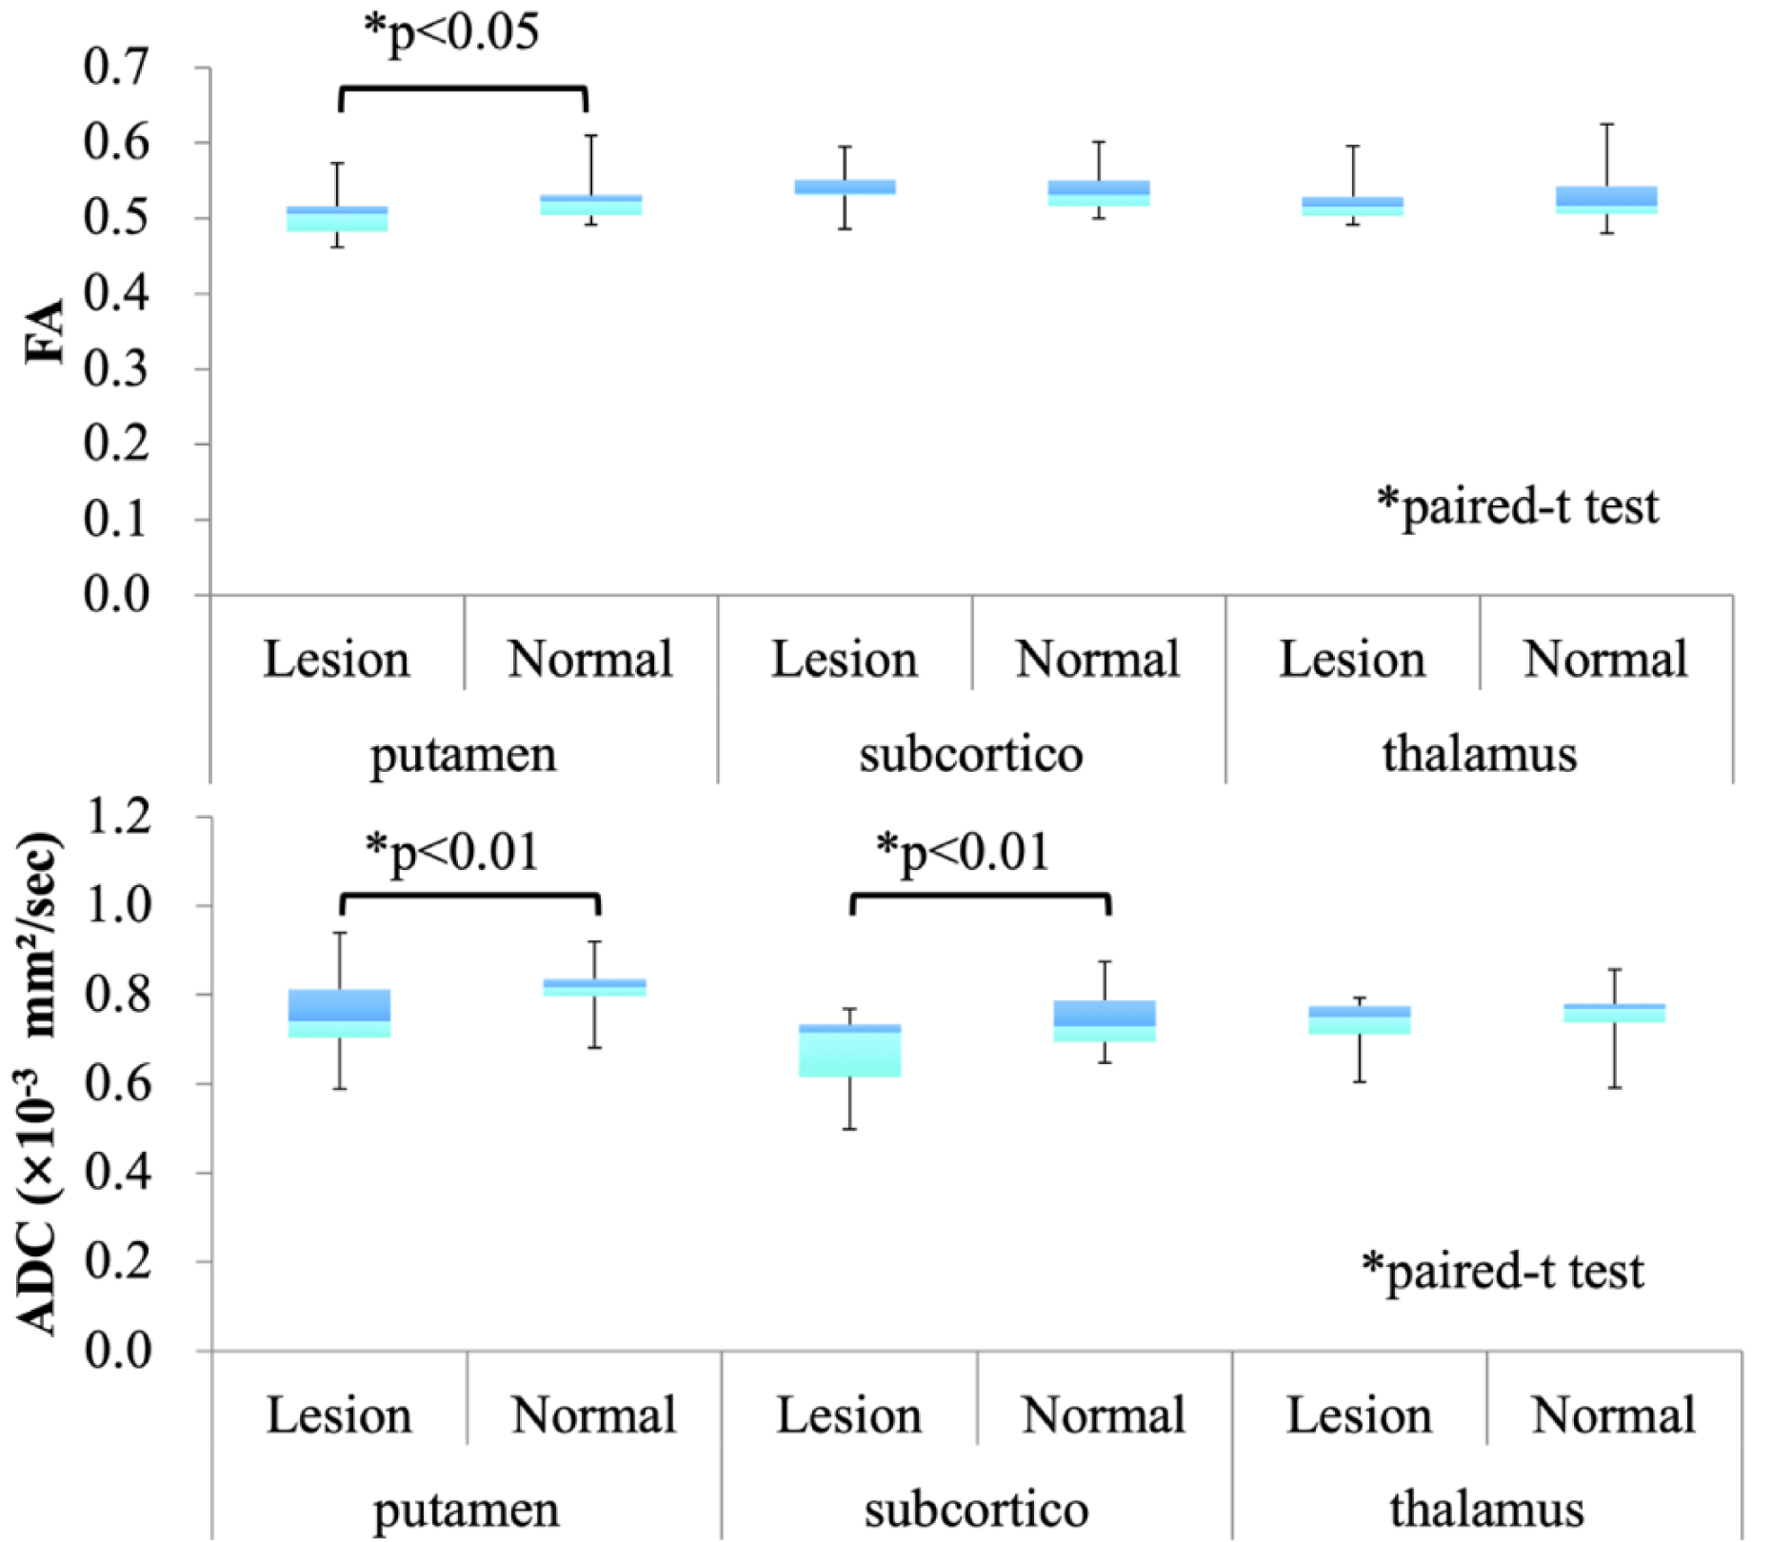 Click for large image | Figure 3. Comparative diffusion tensor imaging (DTI) parameters between the lesion and normal hemisphere in patients with intracerebral hemorrhage (ICH). |
Normal control vs. patients with CSDH and ICH in DTI parameters
FA and ADC values of healthy volunteers obtained using DTI are shown in Supplementary Material 1 (jnr.elmerpub.com).
FA values were significantly lower in the ICH group compared to the normal control group (*P < 0.001, Tukey–Kramer test), while no significant difference was found between the CSDH group and controls (Fig. 4).
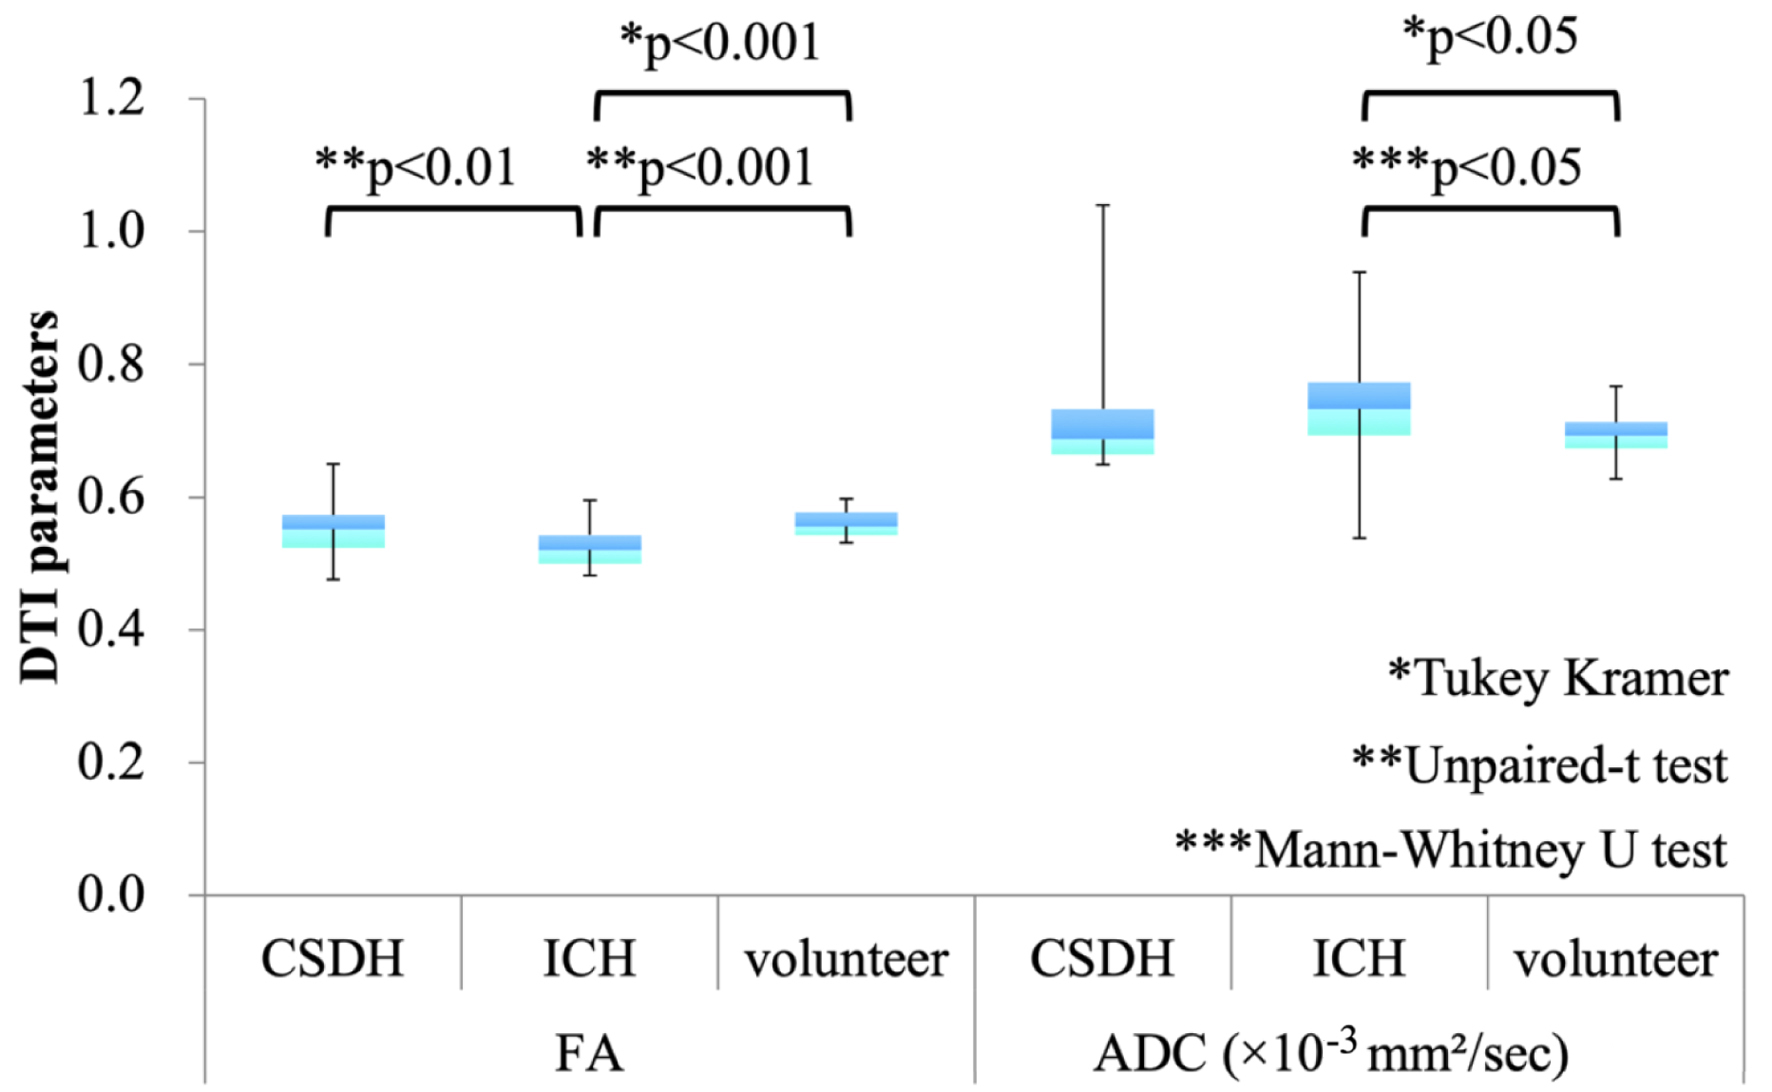 Click for large image | Figure 4. Comparison of fractional anisotropy (FA) and apparent diffusion coefficient (ADC) values among chronic subdural hematoma (CSDH), intracerebral hemorrhage (ICH), and healthy control groups. Bars indicate means, and error bars represent standard deviations. Statistical comparisons are performed using the Tukey–Kramer method for multiple group comparisons. Additionally, pairwise comparisons between the chronic subdural hematoma (CSDH) and intracerebral hemorrhage (ICH) groups are conducted using the unpaired t-test for fractional anisotropy (FA) and the Mann–Whitney U test for apparent diffusion coefficient (ADC). |
Additionally, a direct comparison between the CSDH and ICH groups revealed that preoperative FA values on the lesion side were significantly lower in the ICH group than in the CSDH group (mean ± SD: 0.523 ± 0.0336 vs. 0.552 ± 0.0450, **P = 0.01, unpaired t-test).
A direct comparison between the ICH and control groups also showed a significant difference in FA values (**P < 0.001, unpaired t-test).
For ADC values, no significant difference was observed between the CSDH and ICH groups (mean ± SD: 0.724 ± 0.0820 vs. 0.710 ± 0.0789, ***P = 0.108, Mann–Whitney U test).
Hematoma volume
Hematoma volume in patients with ICH is shown in Figure 5. The mean hematoma volume was 23.58 ± 14.32 mL for putamen hemorrhage, 62.31 ± 39.67 mL for subcortical hemorrhage, and 6.786 ± 6.298 mL for thalamic hemorrhage. Significant differences were observed between putaminal and subcortical hemorrhages (P < 0.01), between putaminal and thalamic hemorrhages (P < 0.01), and between subcortical and thalamic hemorrhages (P < 0.0001).
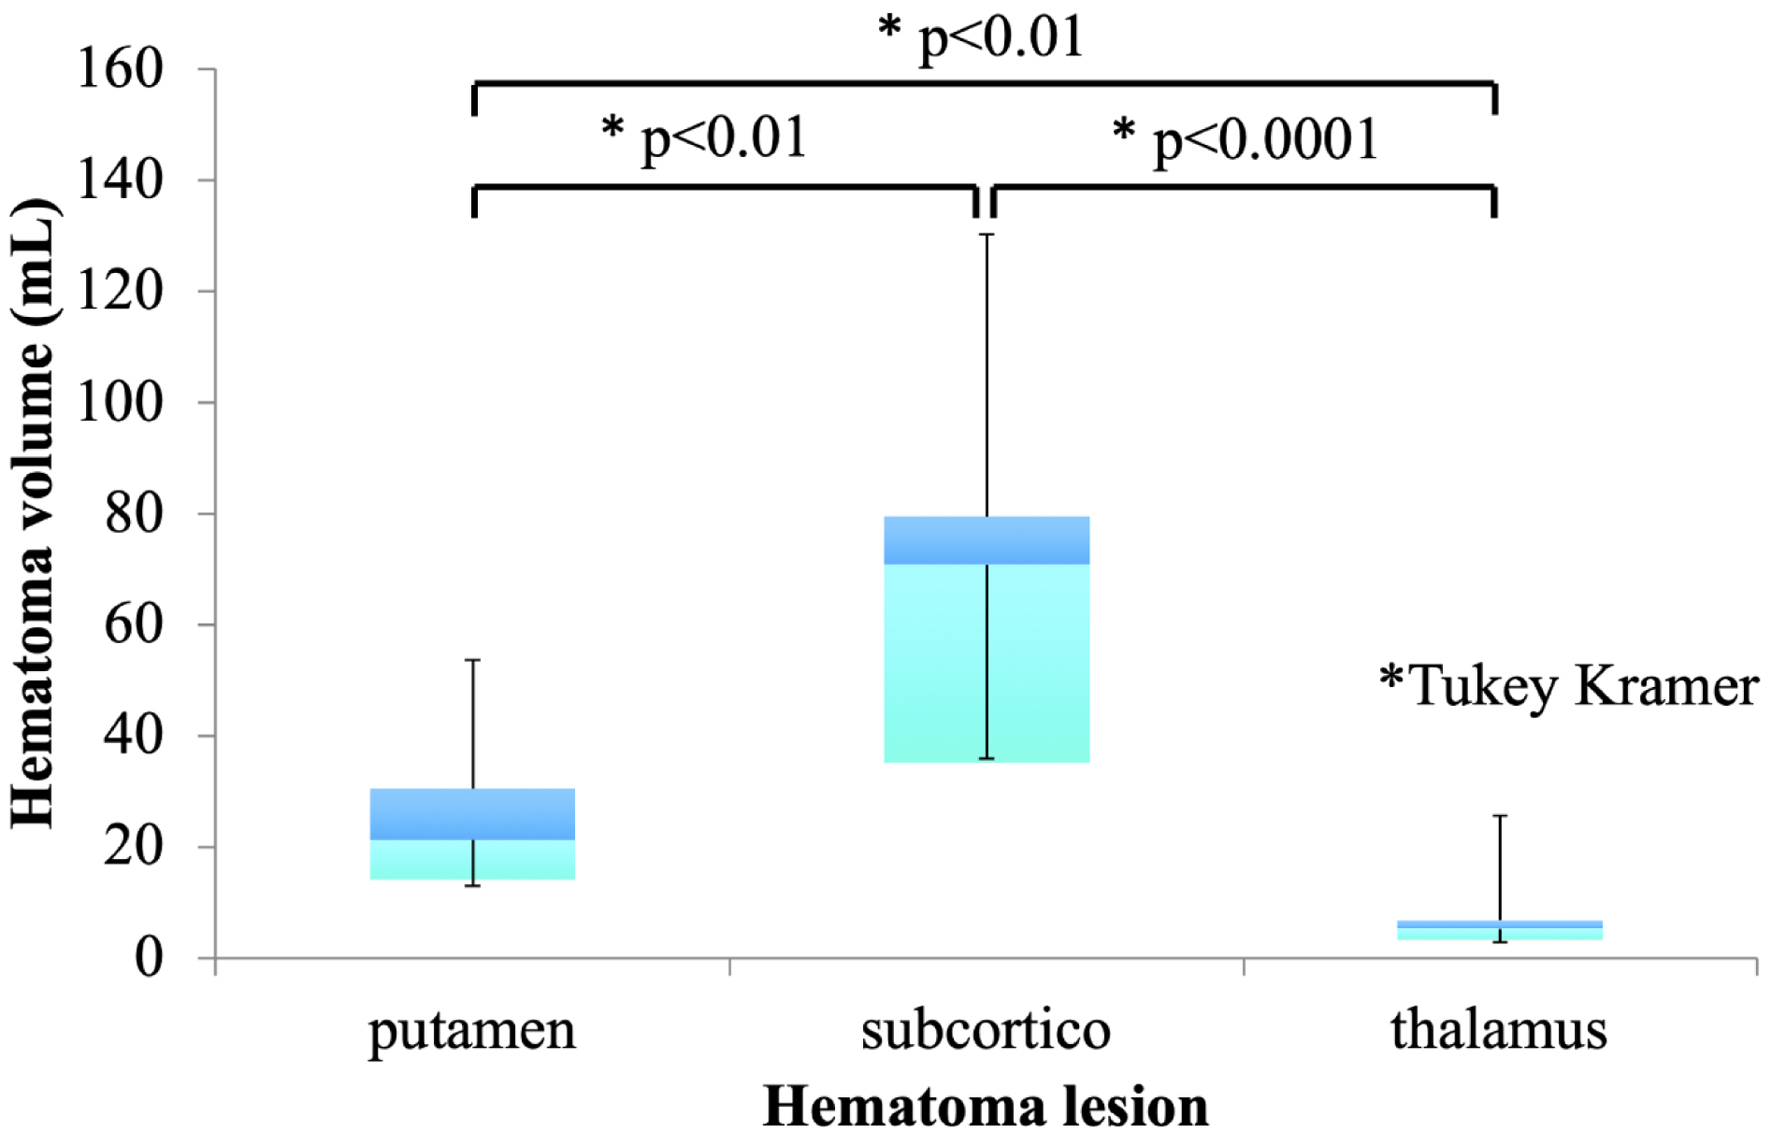 Click for large image | Figure 5. Hematoma volume in patients with intracerebral hemorrhage (ICH). |
mRS score
The mRS score was significantly improved in patients with CSDH (P < 0.01, Mann–Whitney U test) (Fig. 6). Furthermore, an mRS score of 0–2 at discharge was observed in 70% of patients with CSDH compared with 18% of patients with ICH (P < 0.001, Fisher’s exact test). The FA values in the lesion hemisphere CST for all patients showed a negative correlation with the mRS score at discharge (r = −0.480; Fig. 7).
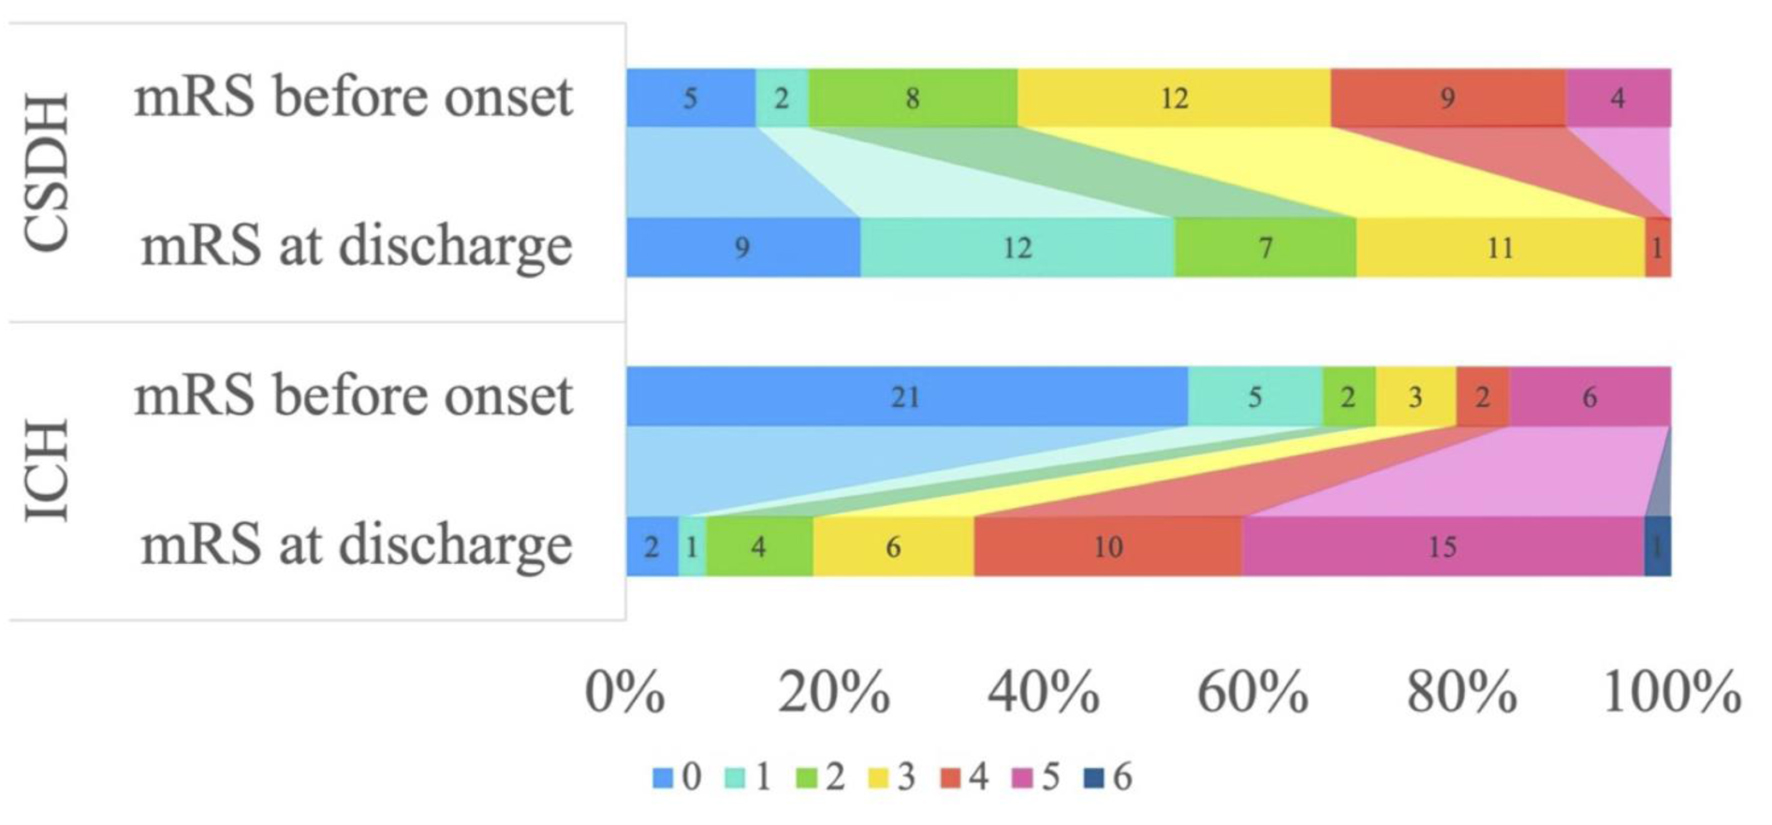 Click for large image | Figure 6. Ordinal distribution of modified Rankin scale (mRS) scores. |
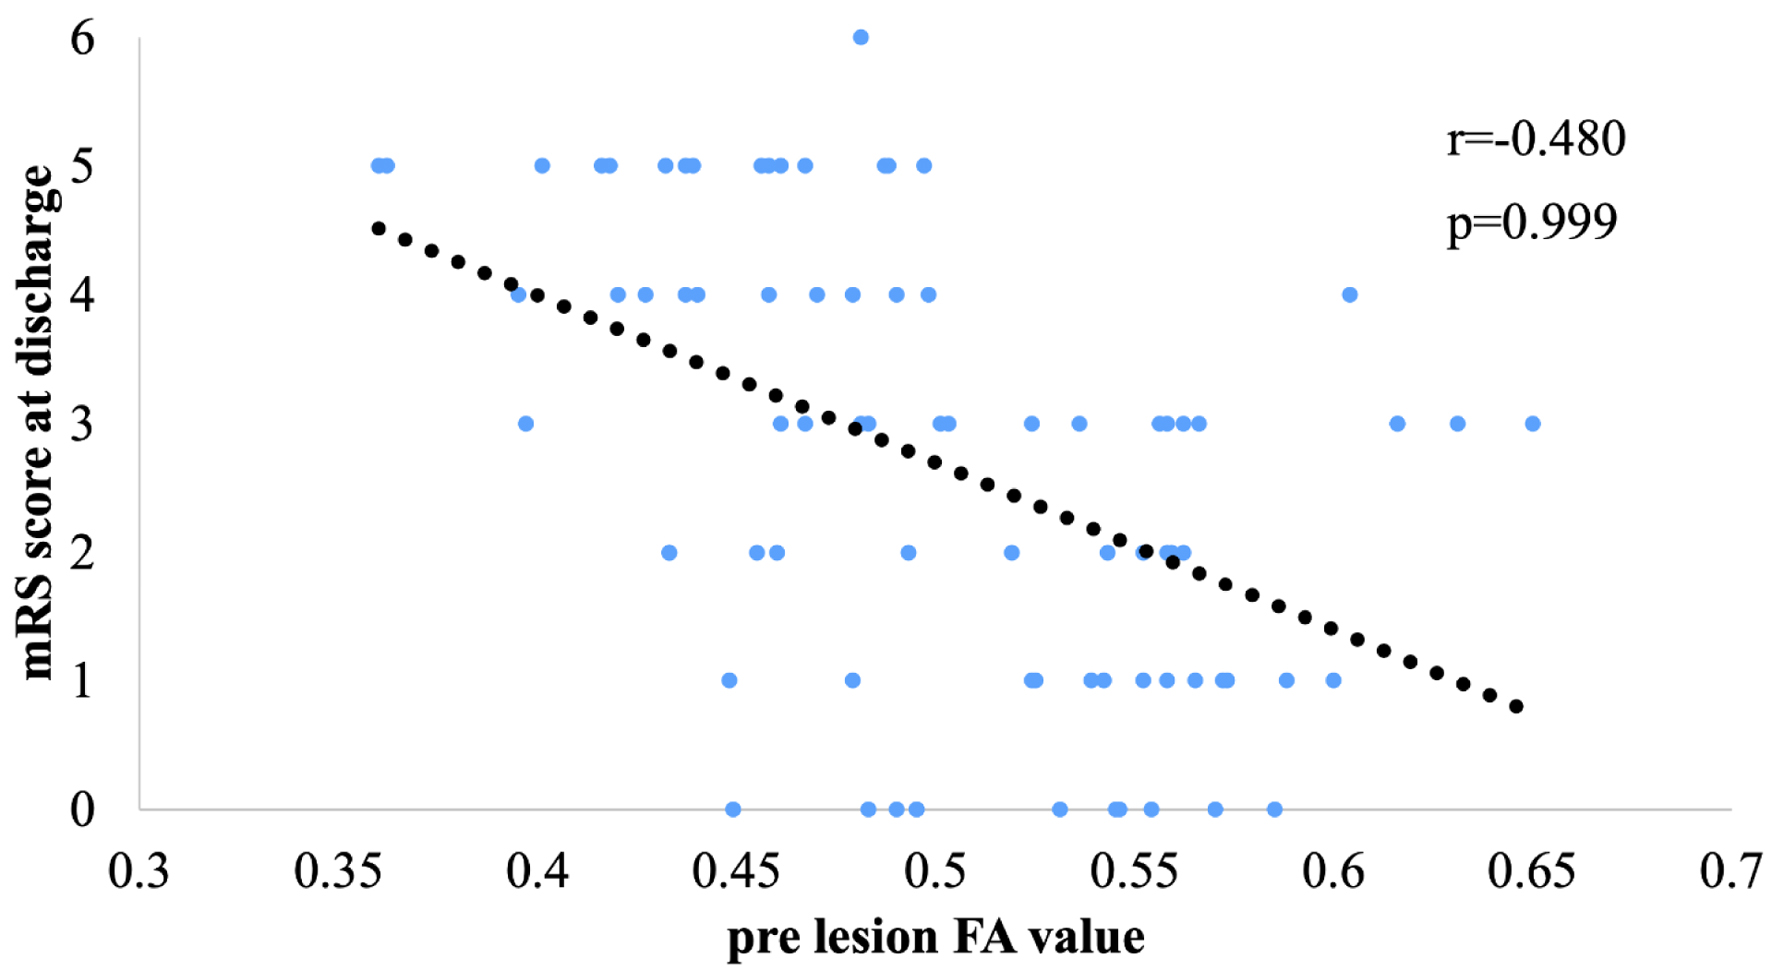 Click for large image | Figure 7. Correlation between lesion fractional anisotropy (FA) value and modified Rankin scale (mRS) score at discharge. |
Inter-rater reliability
Inter-rater reliability for FA and ADC values in each ROI was assessed using ICC(2,1). Observer 2’s FA and ADC measurements for CSDH and ICH are presented in Supplementary Materials 2 and 3 (jnr.elmerpub.com). As shown in Table 3, ICC(2,1) values ranged from 0.622 to 0.924, indicating moderate to excellent agreement. ADC measurements generally demonstrated higher reliability than that demonstrated by FA. The highest ICC (0.924) was observed for ADC in the subcortical ROI, while the lowest (0.622) occurred for ADC in postoperative CSDH lesions.
Click to view | Table 3. Intraclass Correlation Coefficients (ICC(2,1)) Between Two Raters for FA and ADC Measurements in Each ROI |
Multivariable linear regression analysis
In the multivariable linear regression analysis for the whole cohort, the disease group (CSDH vs. ICH) showed a strong trend toward an association with FA values (P = 0.071). In contrast, age (P = 0.774) and lesion location (P = 0.222) did not show significant associations with FA values (Table 4). Furthermore, in the sub-analysis focusing on the ICH group, neither hematoma volume (P = 0.254) nor age (P = 0.771) was significantly associated with FA values.
Click to view | Table 4. Multivariable Linear Regression Analysis for Factors Associated With FA Values |
| Discussion | ▴Top |
In this study, no significant differences in DTI parameters were observed in patients with CSDH pre- and post-surgery compared with healthy controls (Fig. 2). However, in patients with ICH, significant differences in DTI parameters were observed, except for cases of thalamic hemorrhage. Typically, decreased FA values are observed due to edema and injury [12]. However, our results indicate that no factors caused a decrease in FA values in patients with CSDH. This may be because the CST was not damaged by remote compression of motor fibers. Therefore, our results suggest that paralysis may not affect FA values. Our multivariable analysis further supports this, showing that the difference in FA values was primarily driven by the disease group (P = 0.071) rather than age (P = 0.774), lesion location (P = 0.222), or hematoma volume (P = 0.254). These results suggest that the relatively preserved FA in CSDH is independent of confounding factors and reflects the underlying pathological nature of the condition.
FA and ADC values are determined by the balance between fiber destruction and edema. We proposed the “aligned fibers effect” to explain our findings: mechanical compression in narrow regions, such as the spinal cord or internal capsule, can force remaining intact axons into a more uniform orientation [13]. This physical alignment may artificially elevate or maintain FA values, masking subtle microstructural injuries.
Several alternative explanations for the preserved FA values in CSDH must be considered. First, one might argue that the lower FA in ICH is simply due to more extensive perilesional edema or larger hematoma volume compared to CSDH. However, our multivariable analysis demonstrated that hematoma volume was not a significant predictor of FA values (P = 0.254), suggesting that physical mass effect alone cannot account for the microstructural differences. Second, the anatomical location of the lesion could influence DTI parameters; however, location also showed no significant association with FA (P = 0.222) in our model.
Another possibility is that the chronicity of CSDH allows for compensatory structural changes that maintain FA values. While we cannot entirely exclude this, the rapid normalization of clinical symptoms post-surgery strongly suggests a functional displacement rather than a chronic degenerative process. Therefore, while factors such as edema and partial volume effects contribute to DTI changes, the “aligned fibers effect” remains the most plausible mechanism to explain the discrepancy between preserved FA values and clinical motor deficits in CSDH.
Our hypothesis for CSDH is supported by the clinical observation that DTI parameters remain stable despite the presence of a space-occupying hematoma, demonstrating reversibility post-surgery [14]. In contrast, in the ICH group, where hematoma volume was measured, multivariable analysis showed that volume did not significantly affect FA values (P = 0.254). These observations suggest that if nerve fibers are not irreversibly damaged, DTI parameters remain preserved, allowing for the maintenance of motor function. This difference in microstructural reversibility likely accounts for the clinical contrast between the rapid recovery in CSDH and the persistent deficits reflected in worsening mRS scores in ICH.
Regarding thalamic hemorrhages, the mean volume in this study was 6.8 mL, which is below the threshold (7–8 mL) typically associated with significant functional decline [15, 16]. This small volume likely spared the PLIC, resulting in preserved FA values. Additionally, while the diffuse nature of CSDH makes volumetric assessment less reliable than mass effect indicators like midline shift [17], our multivariable analysis confirmed that the observed differences were primarily driven by disease type rather than anatomical location.
Finally, it is important to note that motor deficits can occur without detectable DTI changes due to mechanisms such as reversible cortical ischemia, synaptic dysfunction, or diaschisis [6, 18]. Therefore, while FA is a robust indicator of structural integrity, combining DTI with hemodynamic or functional assessments may provide a more comprehensive understanding of the complex pathophysiology in future studies.
This study has several limitations regarding its internal validity. First, DTI was performed using a minimal configuration (six directions, NSA = 1) without advanced preprocessing. These technical constraints may introduce measurement bias, such as anatomical distortions near air-tissue interfaces, potentially leading to an underestimation of subtle fiber damage [19, 20]. However, since these imaging conditions were identical for both CSDH and ICH groups, the relative differences observed between the conditions remain analytically valid.
Second, the study lacked prospective protocol registration and relied on the mRS at onset, which is less sensitive to subtle motor recovery than specific scales like the Fugl-Meyer assessment [21]. This lack of sensitivity, combined with the absence of premorbid functional data, could introduce information bias, potentially weakening the direct correlation between DTI parameters and clinical outcomes. Nevertheless, our multivariable analysis adjusted for confounding factors, confirming that the disease type is a robust independent predictor of FA values.
Third, although the CST was visualized using anatomical landmarks and a standard three-point ROI method, the influence of adjacent fibers cannot be fully ignored. Due to equipment constraints, it was difficult to completely exclude fibers originating from the brainstem, which may have influenced the DTI parameters. To maintain consistency and reproducibility across cases and to reflect a typical clinical workflow, we did not employ exclusion (NOT) ROIs. While NOT ROIs can refine tract selection, they may introduce subjectivity and reduce generalizability in routine clinical practice. In cases where non-CST fibers were visualized, we addressed the issue by adjusting ROI size and placement rather than using exclusion criteria.
Furthermore, DTT analysis has inherent limitations in visualizing crossing fiber areas, where results may resemble isotropic diffusion, potentially leading to tract interruptions. For such regions, advanced methods like probabilistic tractography are recommended [22].
Fourth, we did not perform formal sensitivity analyses [23], which is a limitation. Specifically, analyzing subgroups by clinical severity or excluding outliers could have further validated the robustness of our multivariable model. The absence of such analyses means that the influence of individual extreme values on the overall results cannot be entirely ruled out.
Additionally, the potential for false-negative FA findings must be acknowledged. Limited angular resolution (six directions), perilesional edema, and partial volume effects could collectively mask subtle white matter damage. Edema, in particular, may increase isotropic water diffusion within the ROI, potentially leading to “false-normal” FA values. While we minimized these effects through careful ROI placement, our findings of preserved CST integrity should be interpreted as a relative comparison to ICH rather than an absolute absence of injury.
Finally, while we proposed the “aligned fibers effect” to explain our findings, this hypothesis may not apply to all brain structures, and its interpretation should consider unique structural and functional differences within the brain.
Conclusion
In conclusion, patients with CSDH demonstrated significantly higher FA values in the CST compared to those with ICH. Our multivariable analysis confirmed that this difference was independently driven by the disease type, rather than confounding factors such as age, lesion location, or hematoma volume. These results suggest that FA values are relatively preserved in CSDH, reflecting a qualitative difference in microstructural involvement compared to the more destructive nature of ICH. However, this finding should be interpreted as a relative preservation of structural integrity in the context of reversible clinical deficits, rather than an absolute absence of microstructural injury. Further studies with higher angular resolution are warranted to more precisely characterize subtle axonal changes in CSDH.
| Supplementary Material | ▴Top |
Suppl 1. The FA and ADC values in healthy controls.
Suppl 2. The FA and ADC values pre- and post-surgery in patients with CSDH by observer 2.
Suppl 3. Comparison of DTI parameters according to ICH lesion location by observer 2.
Acknowledgments
None to declare.
Financial Disclosure
The authors declare that no financial support was received for this research.
Conflict of Interest
The authors declare that there are no conflicts of interest.
Informed Consent
Informed consent was obtained from healthy controls prior to study entry.
Author Contributions
Takumi Yokohama drafted the manuscript. Motoyuki Iwasaki supervised the study. Daisuke Oura and Yoshimasa Niiya provided critical advice regarding the study design and manuscript preparation. All authors reviewed and approved the final manuscript.
Data Availability
The data that support the findings of this study are available from the author upon reasonable request and with permission from the institution.
| References | ▴Top |
- van Everdingen KJ, van der Grond J, Kappelle LJ, Ramos LM, Mali WP. Diffusion-weighted magnetic resonance imaging in acute stroke. Stroke. 1998;29(9):1783-1790.
doi pubmed - Basser PJ, Mattiello J, LeBihan D. MR diffusion tensor spectroscopy and imaging. Biophys J. 1994;66(1):259-267.
doi pubmed - Hagmann P, Jonasson L, Maeder P, Thiran JP, Wedeen VJ, Meuli R. Understanding diffusion MR imaging techniques: from scalar diffusion-weighted imaging to diffusion tensor imaging and beyond. Radiographics. 2006;26(Suppl 1):S205-223.
doi pubmed - Mori S, Zhang J. Principles of diffusion tensor imaging and its applications to basic neuroscience research. Neuron. 2006;51(5):527-539.
doi pubmed - Venkatasubramanian C, Kleinman JT, Fischbein NJ, Olivot JM, Gean AD, Eyngorn I, Snider RW, et al. Natural history and prognostic value of corticospinal tract Wallerian degeneration in intracerebral hemorrhage. J Am Heart Assoc. 2013;2(4):e000090.
doi pubmed - Yokoyama K, Matsuki M, Shimano H, Sumioka S, Ikenaga T, Hanabusa K, Yasuda S, et al. Diffusion tensor imaging in chronic subdural hematoma: correlation between clinical signs and fractional anisotropy in the pyramidal tract. AJNR Am J Neuroradiol. 2008;29(6):1159-1163.
doi pubmed - Laundre BJ, Jellison BJ, Badie B, Alexander AL, Field AS. Diffusion tensor imaging of the corticospinal tract before and after mass resection as correlated with clinical motor findings: preliminary data. AJNR Am J Neuroradiol. 2005;26(4):791-796.
pubmed - Mukherjee P, Chung SW, Berman JI, Hess CP, Henry RG. Diffusion tensor MR imaging and fiber tractography: technical considerations. AJNR Am J Neuroradiol. 2008;29(5):843-852.
doi pubmed - Ahn S, Lee SK. Diffusion tensor imaging: exploring the motor networks and clinical applications. Korean J Radiol. 2011;12(6):651-661.
doi pubmed - Sato E, Isobe T, Yamamoto T, Matsumura A. [Basic principle and image analysis in the diffusion tensor image]. Igaku Butsuri. 2016;36(2):97-102.
doi pubmed - Kothari RU, Brott T, Broderick JP, Barsan WG, Sauerbeck LR, Zuccarello M, Khoury J. The ABCs of measuring intracerebral hemorrhage volumes. Stroke. 1996;27(8):1304-1305.
doi pubmed - Rajasekaran S, Kanna RM, Karunanithi R, Shetty AP. Diffusion tensor tractography demonstration of partially injured spinal cord tracts in a patient with posttraumatic Brown Sequard syndrome. J Magn Reson Imaging. 2010;32(4):978-981.
doi pubmed - Iwasaki M, Yokohama T, Oura D, Furuya S, Niiya Y, Okuaki T. Decreased value of highly accurate fractional anisotropy using 3-Tesla ZOOM diffusion tensor imaging after decompressive surgery in patients with cervical spondylotic myelopathy: aligned fibers effect. World Neurosurg X. 2019;4:100056.
doi pubmed - Yokohama T, Iwasaki M, Oura D, Furuya S, Niiya Y. Increased muscle fiber fractional anisotropy value using diffusion tensor imaging after compression without fiber injury. Acta Radiol. 2023;64(1):139-146.
doi pubmed - Toyoda O, Nakajima H, Kakegawa T, Nakajima S, Arai K, Kobayashi T. [Relationship between hematoma volume and the prognosis for thalamic hemorrhage]. Neurol Med Chir (Tokyo). 1987;27(10):968-972.
doi pubmed - Hiraoka S, Maeshima S, Okazaki H, Hori H, Tanaka S, Okamoto S, Funahashi R, et al. Factors necessary for independent walking in patients with thalamic hemorrhage. BMC Neurol. 2017;17(1):211.
doi pubmed - Sucu HK, Gokmen M. The value of computed tomographic volume of chronic subdural hematoma in estimating the prognosis. Acta Neurochir (Wien). 2009;151:41-47.
doi - Petersen ET, Zimine I, Ho YC, Golay X. Non-invasive measurement of perfusion: a critical review of arterial spin labelling techniques. Br J Radiol. 2006;79(944):688-701.
doi pubmed - Skudlarski P, Jagannathan K, Calhoun VD, Hampson M, Skudlarska BA, Pearlson G. Measuring brain connectivity: diffusion tensor imaging validates resting state temporal correlations. Neuroimage. 2008;43(3):554-561.
doi pubmed - Hamaguchi A, Kodera S. [Influence exerted by MPG-directions on diffusion tensor imaging (DTI)]. Nihon Hoshasen Gijutsu Gakkai Zasshi. 2009;65(7):913-920.
doi pubmed - Gladman J, Lincoln N, Barer D. A comparison of the Cogwheel Test, the Motricity Index and the Fugl-Meyer Assessment in the measurement of motor impairment after stroke. Clin Rehabil. 1992;6:283-289.
doi - Behrens TE, Berg HJ, Jbabdi S, Rushworth MF, Woolrich MW. Probabilistic diffusion tractography with multiple fibre orientations: What can we gain? Neuroimage. 2007;34(1):144-155.
doi pubmed - Thabane L, Mbuagbaw L, Zhang S, Samaan Z, Marcucci M, Ye C, Thabane M, et al. A tutorial on sensitivity analyses in clinical trials: the what, why, when and how. BMC Med Res Methodol. 2013;13:92.
doi pubmed
This article is distributed under the terms of the Creative Commons Attribution 4.0 International License (CC BY 4.0), which permits unrestricted use, distribution, and reproduction in any medium, including commercial use, provided the original work is properly cited.
Journal of Neurology Research is published by Elmer Press Inc.