| Journal of Neurology Research, ISSN 1923-2845 print, 1923-2853 online, Open Access |
| Article copyright, the authors; Journal compilation copyright, J Neurol Res and Elmer Press Inc |
| Journal website https://jnr.elmerpub.com |
Original Article
Volume 16, Number 3, September 2026, pages 158-164

Longitudinal Changes in Pituitary Area in Individuals Undergoing Magnetic Resonance Imaging Checkups
Sukwoo Honga, b, c
aDepartment of Neurosurgery, Tokyo Neuro-Center, Tokyo, Japan
bDepartment of Neurological Surgery, Mayo Clinic, Phoenix, AZ, USA
cCorresponding Author: Sukwoo Hong, Department of Neurological Surgery, Mayo Clinic, Phoenix, AZ 85054, USA
Manuscript submitted February 20, 2026, accepted May 27, 2026, published online August 5, 2026
Short title: Longitudinal Changes in Pituitary Area
doi: https://doi.org/10.14740/jnr1108
| Abstract | ▴Top |
Background: The aim of the study was to investigate longitudinal changes in pituitary area and their associations with baseline characteristics and lifestyle factors in individuals undergoing brain magnetic resonance imaging (MRI) checkups.
Methods: A retrospective analysis was performed on 151 MRI from 52 individuals who underwent at least two checkups. Pituitary area was manually delineated on mid-sagittal T1-weighted MRI. Longitudinal changes were evaluated using linear mixed-effects models with random intercepts for individuals and fixed effects including time from baseline, sex, smoking status, and alcohol intake.
Results: The median age at baseline MRI was 61 years (interquartile range (IQR), 50–65), with 46 males (88%). The median interval between consecutive MRIs was 1.05 years (IQR, 0.98–1.90), and the median interval from first to last MRI was 2.16 years (IQR, 1.15–4.88). Never-smokers constituted 38%, and regular alcohol drinkers 69%. In the primary mixed-effects model, male sex (β = 3.28, P < 0.01), regular alcohol intake (β = −1.84, P = 0.02), and longer interval from baseline (β = −0.44, P < 0.01) were associated with pituitary area change, whereas smoking status and baseline age were not significant. In a sensitivity analysis adjusting for baseline pituitary area, the association with longer interval from baseline remained significant, whereas the alcohol-related association was attenuated and no longer statistically significant. An exploratory quadratic analysis suggested a modest nonlinear relationship between weekly pure alcohol intake and pituitary area change.
Conclusion: Progressive reduction in pituitary area within the same individuals over time was observed. Exploratory alcohol-related differences warrant further investigation.
Keywords: Pituitary; Gland; Longitudinal; Smoke; Alcohol
| Introduction | ▴Top |
The pituitary gland is a small but essential endocrine organ that regulates multiple hormonal systems. Previous studies have investigated its size and morphology using magnetic resonance imaging (MRI) [1, 2]. More recent work has demonstrated that pituitary volume is generally greater in females and in individuals with obesity (body mass index (BMI) ≥ 30 kg/m2) and decreases with age [3–5]. In addition, pituitary area has been reported to be smaller in smokers than in never-smokers [2]. Moreover, pituitary volume has been shown to be smaller in individuals with alcohol use disorder (AUD) compared with healthy controls [6].
However, these investigations have been cross-sectional, limiting the ability to assess within-individual changes over time [7, 8]. Few studies have longitudinally followed the same individuals with repeated imaging to evaluate temporal changes in pituitary morphology, and none have examined whether habitual alcohol intake is associated with such changes within individuals. A previous study demonstrated that pituitary cross-sectional area of the gland was positively correlated to the estimated pituitary volume (r = 0.73, P < 0.01), supporting the use of two-dimensional area measurements as a practical surrogate for pituitary size when dedicated volumetric analysis is not available [9]. Recent studies have also suggested that AUD is associated with alterations in hypothalamic–pituitary–adrenal (HPA) axis function and body composition compared with individuals without AUD [10, 11].
The present study aimed to evaluate longitudinal changes in pituitary area within the same individuals by analyzing repeated MRI examinations. We further examined whether baseline characteristics and lifestyle factors, including smoking and alcohol intake, were associated with changes in pituitary area over time.
| Materials and Methods | ▴Top |
Individual selection and imaging evaluation
We included 167 individuals who underwent voluntary brain MRI checkups between October 2024 and June 2025 at a single institution in Japan. For each case, prior MRI examinations were identified using our picture archiving and communication system (PACS; Fujifilm). Of these, 115 individuals without a previous MRI were excluded. The final cohort comprised 52 individuals with ≥ 2 MRIs, including the latest examination. No included individuals had a history of pituitary surgery or radiological evidence of complete empty sella. Cases with partial empty sella were included if the pituitary gland remained appreciable. Before imaging, all individuals completed standardized questionnaires documenting sex, smoking status, and alcohol intake. All individuals were Asian. All MRIs were performed as part of voluntary brain health checkups, not for clinical symptoms. All MRIs were performed using the same 1.5-T scanner (Siemens Healthineers, Erlangen, Germany) with a consistent imaging protocol throughout the study period. Because the same individuals were analyzed longitudinally, intracranial volume correction was not applied, as head size remains constant over time and within-subject comparisons minimize interindividual variance. Lifestyle variables, including alcohol intake and smoking status, were assessed by questionnaire at each MRI examination. Alcohol intake was relatively stable across serial assessments in most individuals. For the primary analysis, participants were classified as regular drinkers or non-regular drinkers based on self-reported habitual alcohol consumption. In exploratory analyses, weekly pure alcohol intake (mL/week) was analyzed as a continuous variable. Weekly alcohol consumption (in mL of pure ethanol) was estimated using beverage-specific alcohol concentrations. Smoking exposure showed greater variability across time points; therefore, smoking status was dichotomized as never-smoker versus ever-smoker for analysis.
On mid-sagittal T1-weighted spin-echo MRI (3-mm slice thickness), the pituitary area was manually delineated and automatically calculated using PACS (Fig. 1a). Each measurement was repeated on two separate occasions, and the mean was used for analysis. Formal intra-rater or inter-rater reliability testing was not performed. Measurements were not performed in a blinded fashion with respect to imaging time point or questionnaire data. For each subject, the first pituitary area measurement (earliest MRI) was defined as baseline, and changes in pituitary area were calculated relative to baseline across subsequent MRIs. The reader was blinded to the status of smoking or alcohol status at the time of measurement. Pituitary area change was set as the outcome, and baseline questionnaire features were used as predictors.
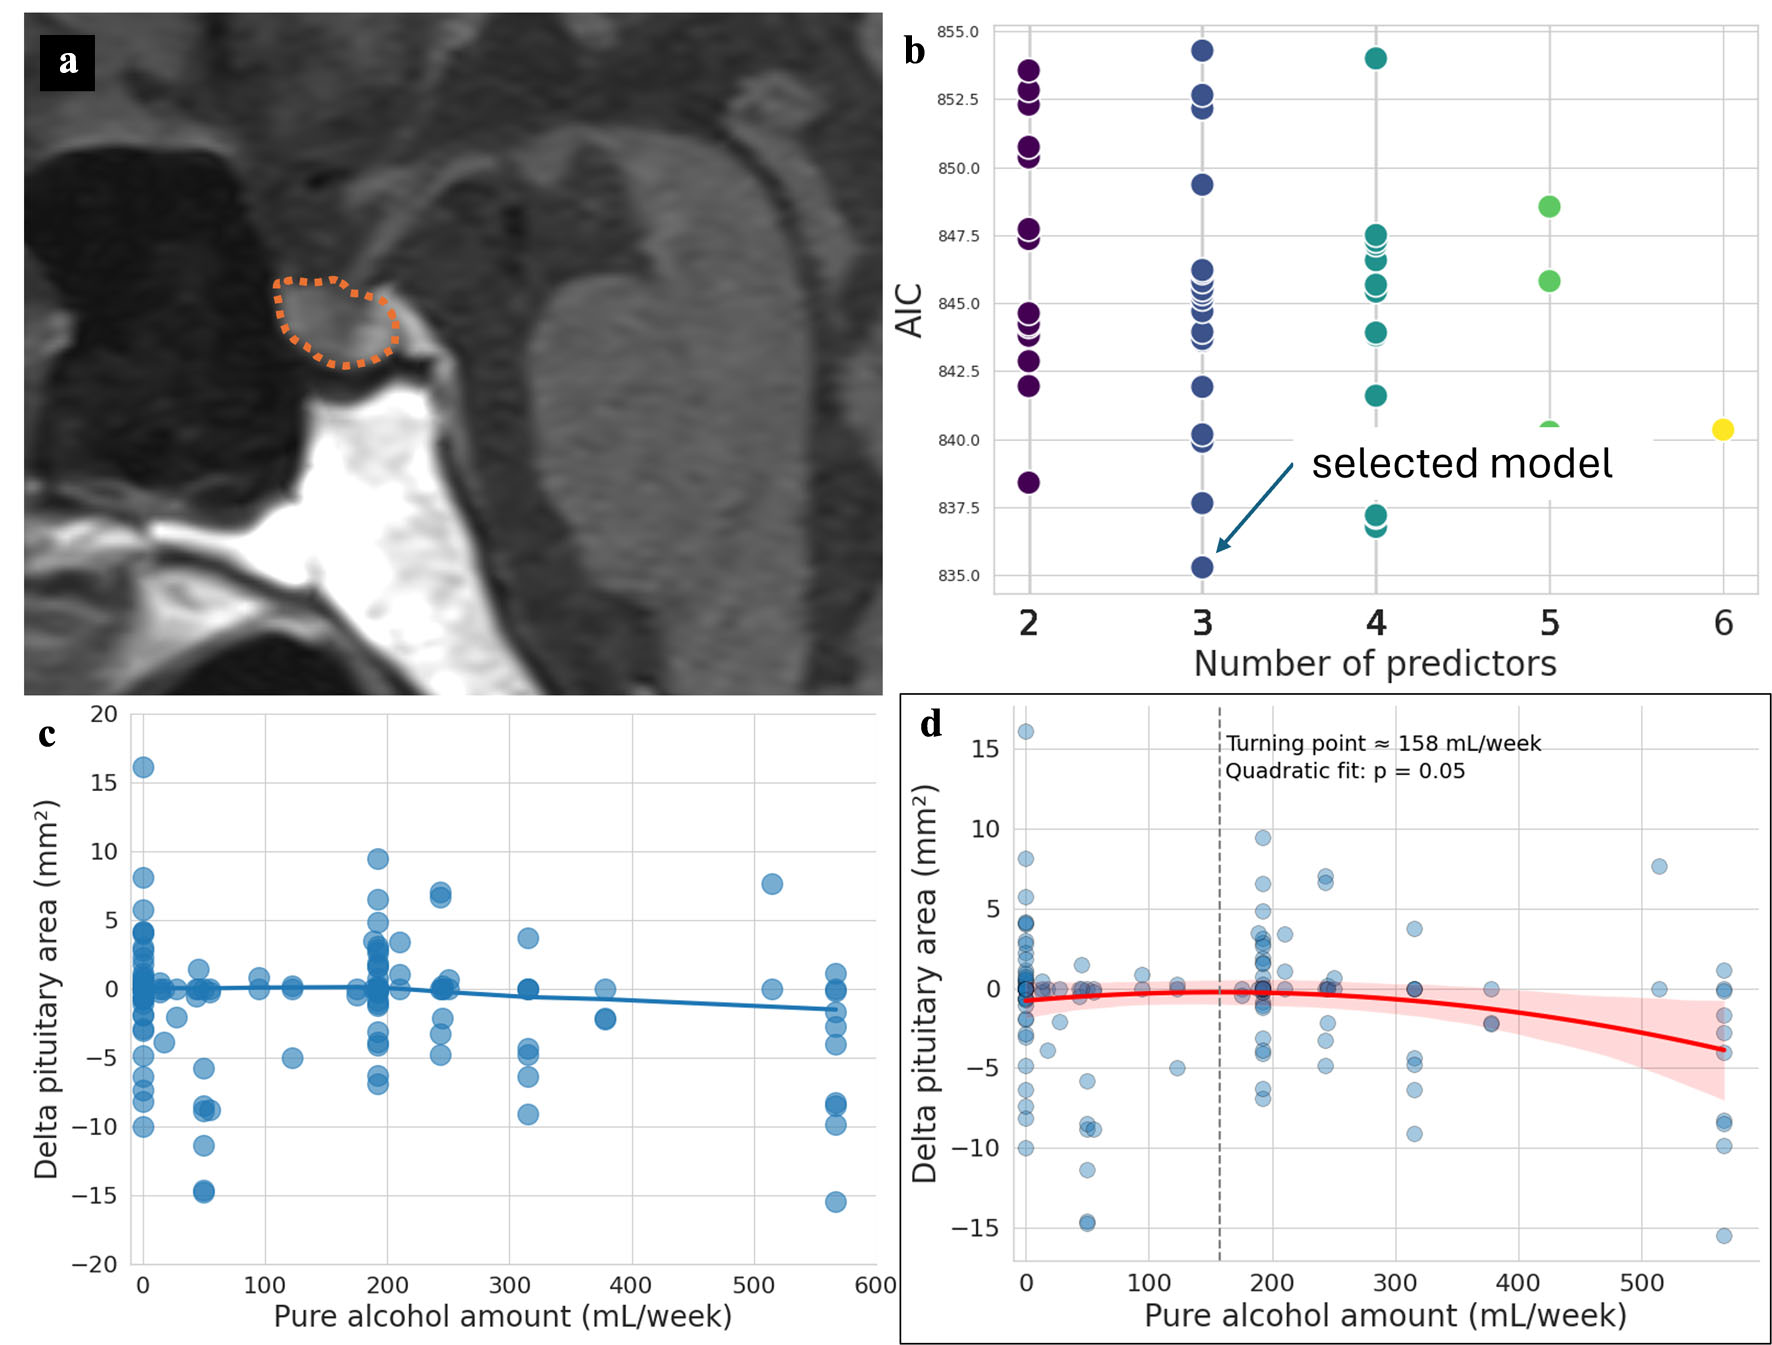 Click for large image | Figure 1. Pituitary area delineated with orange dots (a). Akaike information criterion (AIC) for all feature combinations (b); selected model indicated. Relationship between pure alcohol amount and pituitary area change (Δ pituitary area; c). The fitted quadratic regression curve shows an exploratory nonlinear association between weekly alcohol intake and pituitary area change. The apparent inflection point at approximately 158 mL/week is shown for descriptive purposes only (d). |
Statistical analysis
Continuous variables were summarized as mean ± standard deviation if normally distributed, or as median with interquartile range (IQR) if non-normally distributed. Normality was tested with the Shapiro–Wilk test. Categorical variables were reported as counts and percentages. Chi-square, Fisher’s exact, and Mann–Whitney U tests were used as appropriate.
Linear mixed-effects regression models were fitted with patient ID as a random intercept and baseline features as fixed effects. Univariate analyses were first performed. Correlations among features were assessed, and variables with correlation coefficients ≥ 0.7 were excluded. Variance inflation factors were checked to ensure all < 5. Candidate predictors were evaluated in multivariable models exploratorily using Akaike information criterion (AIC) values to assess relative model fit. Results were reported as unstandardized coefficients (β) with 95% confidence intervals (CIs) and P-values. Exploratory random slope mixed-effects models were also evaluated as sensitivity analyses. Additionally, exploratory analysis was performed to examine the relationship between pure alcohol amount and pituitary area change using a quadratic regression model. A P-value ≤ 0.05 was considered statistically significant. All analyses were conducted using Python 3.12 (Python Software Foundation), with the statsmodels, pandas, matplotlib, and seaborn libraries.
Institutional Review Board approval and ethical statements
This study was approved by the Institutional Review Board of Tokyo Neuro-Center (currently known as the Tokyo Neurological Academy). This study was performed in line with the principles of the Declaration of Helsinki.
| Results | ▴Top |
Baseline characteristics
Fifty-two individuals underwent 151 MRI examinations (Table 1). Thirty-two (62%) had two MRIs, 10 (19%) had three, and 10 (19%) had more than three. The median age at baseline was 61 years (IQR, 50–65), and 46 (88%) were male. The median interval between consecutive MRIs was 1.05 years (IQR, 0.98–1.90), and the median interval from the first to last MRI was 2.16 years (IQR, 1.15–4.88). Twenty individuals (38%) were never-smokers, and 36 (69%) reported regular alcohol intake.
 Click to view | Table 1. Baseline Characteristics |
Baseline characteristics stratified by sex are summarized in Table 2. Compared with males, females tended to have more MRI examinations (median 4 vs. 2, P = 0.06), longer follow-up (median 4.92 vs. 2.05 years, P = 0.08), and larger baseline pituitary area (mean 48.6 vs. 36.6 mm2, P = 0.10). A greater proportion of females were never-smokers (83% vs. 33%, P = 0.03).
Click to view | Table 2. Baseline Characteristics by Sex |
Linear mixed-effects regression analyses
In univariate analyses, male sex and interval from first to last MRI were associated with pituitary area change. Feature evaluation (Fig. 1b) identified the optimal multivariable model, which included male sex, regular alcohol intake, and interval from first to last MRI. In multivariable analysis, male sex (P < 0.01), regular alcohol intake (P = 0.02), and interval from baseline (P < 0.01) were independently associated with pituitary area change (Table 3). Additional analysis including a smoking-by-alcohol interaction term did not demonstrate a significant interaction effect (β = 0.37, P = 0.82). In a sensitivity analysis incorporating baseline pituitary area as a covariate, longer interval from baseline remained significantly associated with smaller pituitary area (β = −0.42, P < 0.01), whereas the association with regular alcohol intake was attenuated and no longer statistically significant (P = 0.22). Exploratory random slope mixed-effects models demonstrated similar directional trends but did not fully converge.
Click to view | Table 3. Linear Mixed-Effects Models of Longitudinal Changes in Pituitary Area |
Individual longitudinal trajectories of pituitary area are shown in Figure 2a. The effect of alcohol intake stratified by sex is shown in Figure 2b and c. In both sexes, regular alcohol consumption was associated with a greater decline in pituitary area over time. In males, regular drinkers declined more than non-drinkers (slope difference β = −1.41, 95% CI −1.98 to −0.85; P < 0.01). In females, the decline was also greater in regular drinkers (slope difference β = −1.18, 95% CI −2.27 to −0.08; P = 0.04). Comparisons by alcohol status are shown in Figure 2d and e: in individuals without regular alcohol intake, pituitary area remained stable over time, whereas in those with regular intake, pituitary area decreased (slope difference between males and females: β = 1.60, 95% CI 0.59–2.61; P < 0.01). A formal interaction term between sex and regular alcohol intake was explored in the primary mixed-effects model and was not statistically significant (β = 0.93, P = 0.66), although interpretation is limited by the small number of female participants.
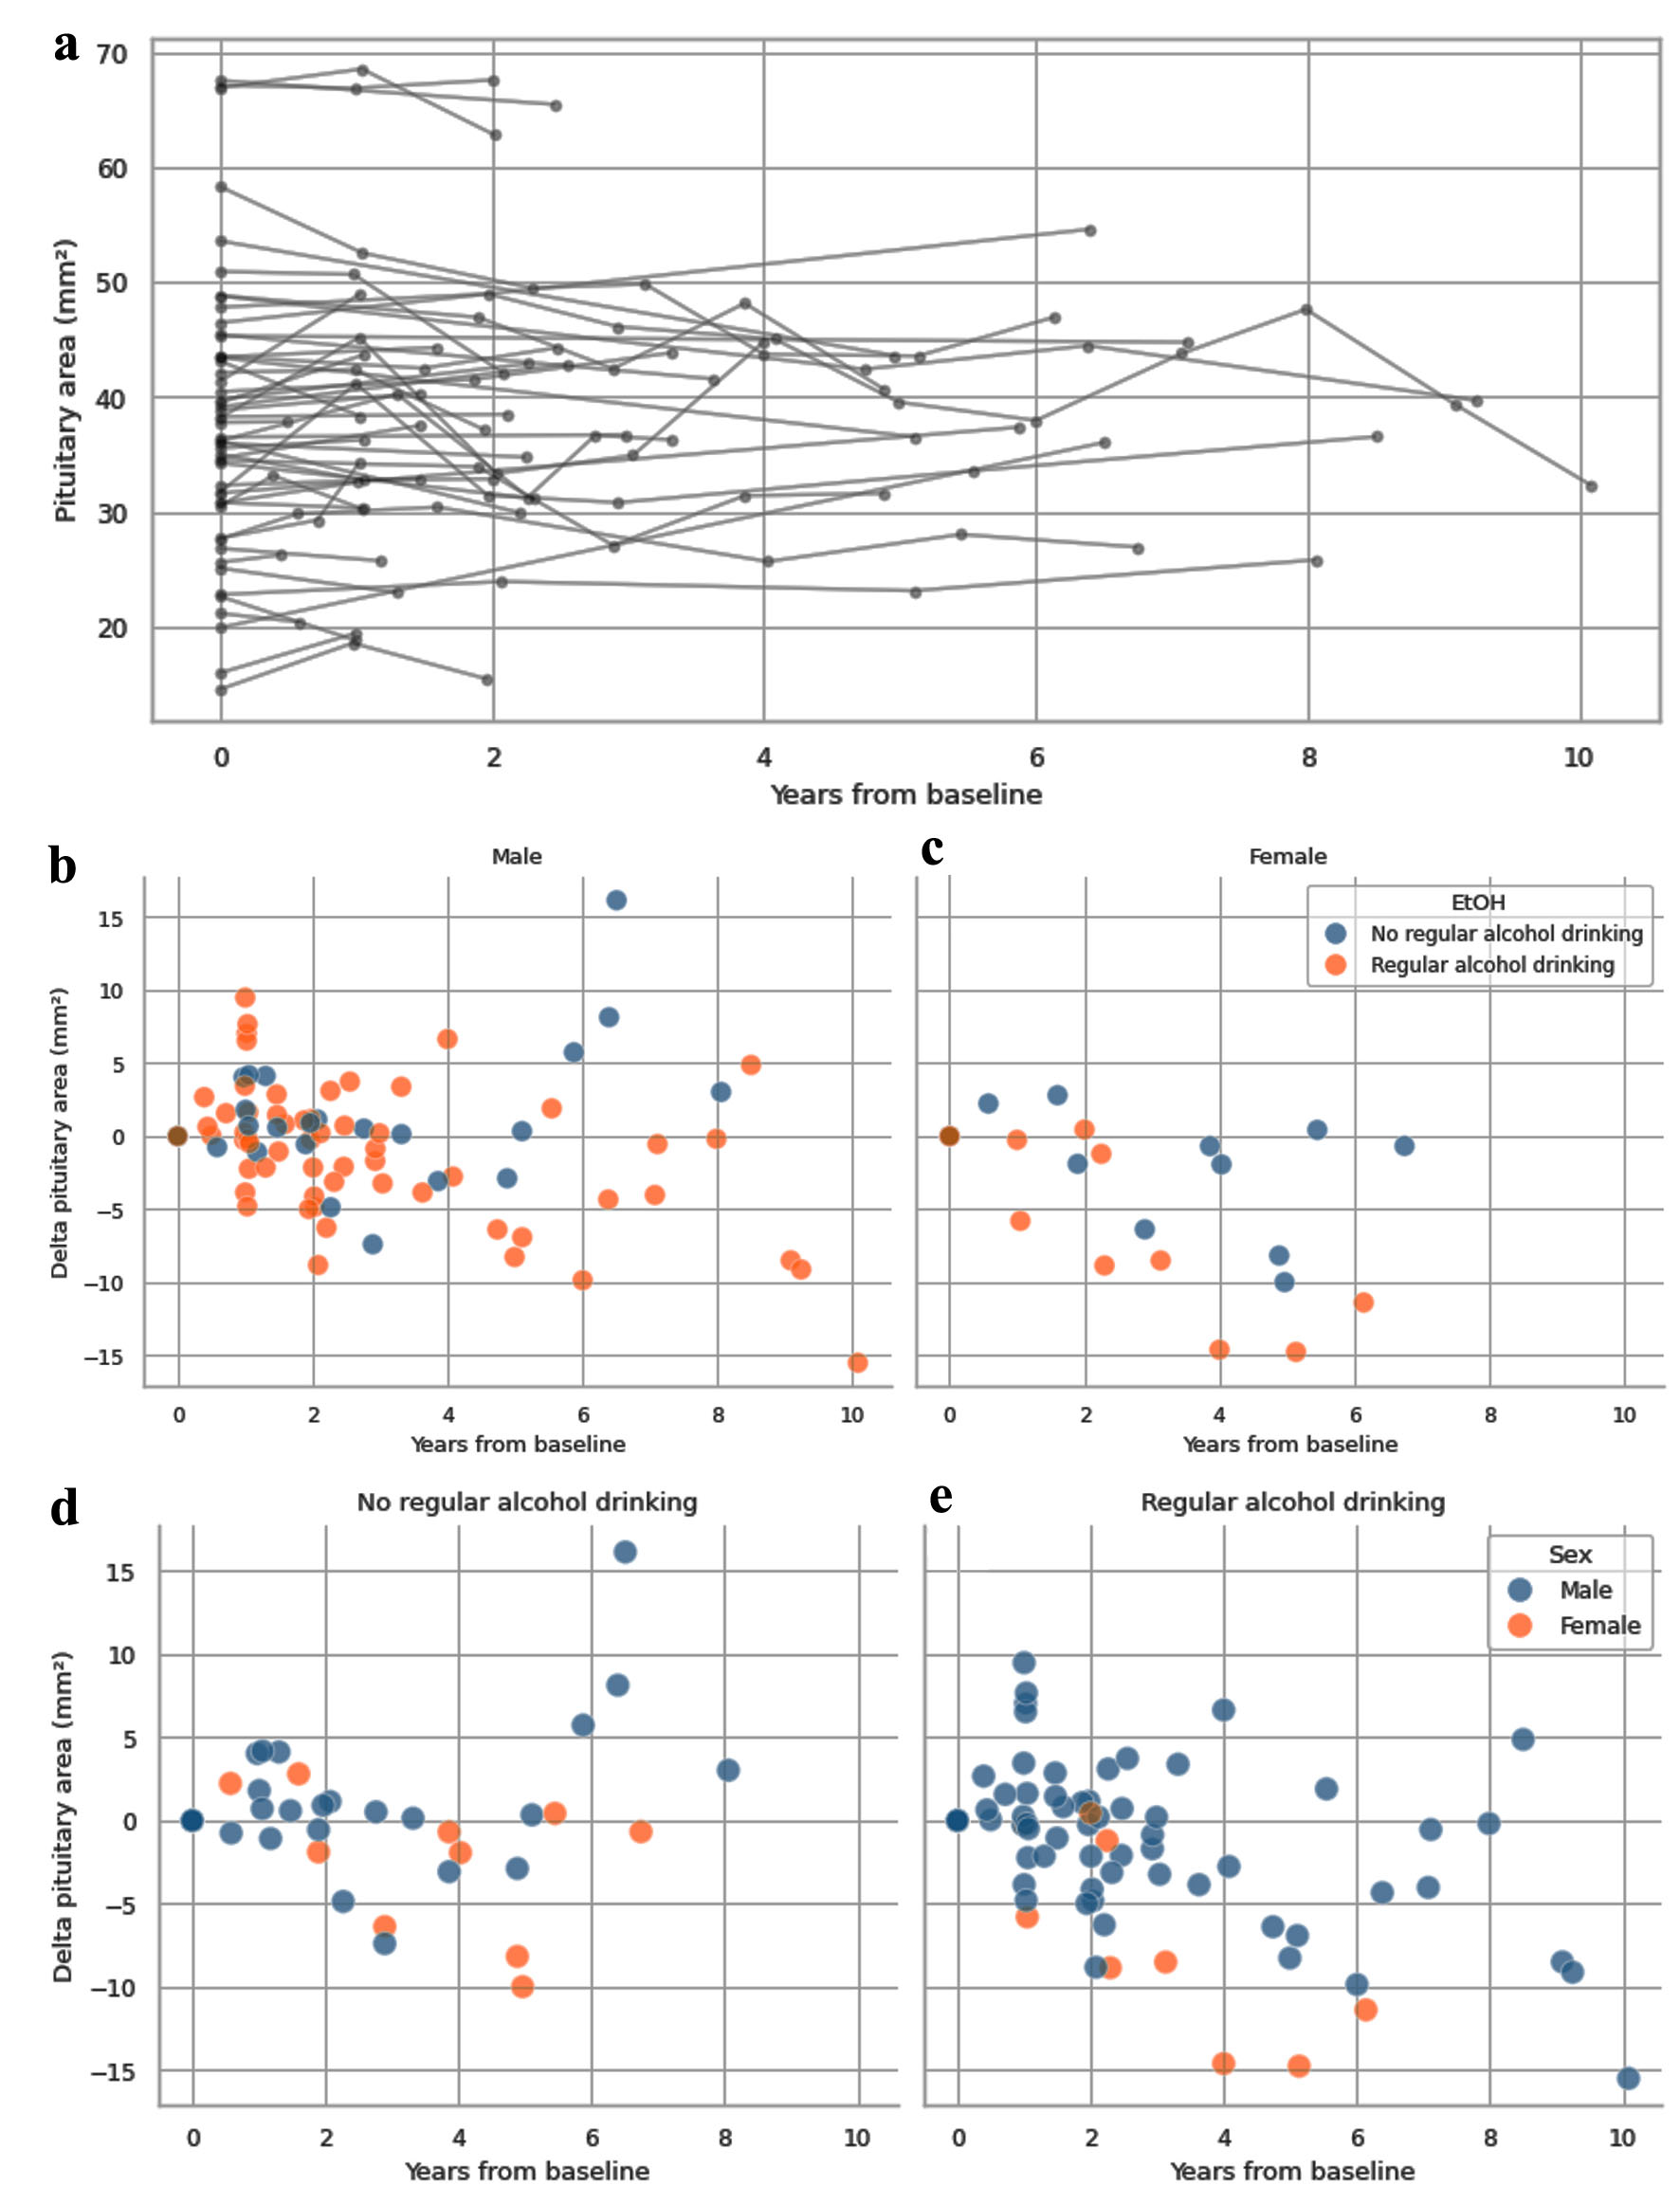 Click for large image | Figure 2. Individual longitudinal trajectories of pituitary area (a). Effect of alcohol intake on longitudinal changes in pituitary area by sex. Male: pituitary area change in those who drink alcohol regularly vs. those who do not (b). Female: pituitary area change in those who drink alcohol regularly vs. those who do not (c). People with no regular alcohol intake (d). People with regular alcohol intake (e). |
Exploratory analysis on alcohol amount
Figure 1c shows the relationship between pituitary area change based on weekly pure alcohol intake. An exploratory quadratic model (Fig. 1d) revealed a modest nonlinear association between pure alcohol intake and pituitary area change (P = 0.05). The fitted curve suggested that pituitary area tended to decrease at higher levels of alcohol intake, although the apparent inflection point at approximately 158 mL/week should be interpreted as a visual estimate rather than a definitive threshold.
| Discussion | ▴Top |
Key findings
This study demonstrates that pituitary area decreases longitudinally within individuals over time. Regular alcohol intake may be associated with a decrease in pituitary area, and a possible sex-related difference was observed. Given the modest sample size and exploratory model-selection strategy, the findings should be interpreted cautiously and considered hypothesis-generating. The association between alcohol intake and pituitary area was attenuated after adjustment for baseline pituitary size, suggesting that the observed relationship may partly reflect baseline structural differences. Although exploratory subgroup analyses suggested possible sex-related differences, the formal sex-by-alcohol interaction was not statistically significant, and these findings should be considered hypothesis-generating only.
Comparison with prior studies
A previous cross-sectional study has shown that smoking status is associated with smaller pituitary area, which was not apparent in the current longitudinal study [2]. The attenuated effect of smoking may reflect the limited sample size and the model’s adjustment for within-individual correlations, suggesting that smoking influences absolute pituitary size more than its temporal trajectory. These findings underscore the importance of longitudinal modeling in clarifying factors associated with pituitary morphometric changes over time.
One prior longitudinal study on 33 individuals reported that weight loss exceeding 5% of baseline was associated with significant reductions in pituitary volume. In the present study, BMI and weight were not included as predictors due to insufficient longitudinal data. Another longitudinal study on 20 individuals with two MRI follow-ups did not demonstrate a significant decrease in pituitary volume, possibly due to the smaller sample size compared with the current study of 52 individuals.
Alcohol-related brain atrophy has been demonstrated in a large cohort study [12]. Furthermore, evidence indicates that females are more susceptible than males to alcohol-related reductions in brain volume [13]. Although our initial multivariable model demonstrated an association between regular alcohol intake and longitudinal pituitary area reduction, this association was attenuated and no longer statistically significant in the sensitivity analysis adjusting for baseline pituitary area. This may reflect the modest cohort size and the use of two-dimensional pituitary area measurements rather than dedicated volumetric analysis. Pituitary morphology may be influenced by multiple physiological, metabolic, and endocrine factors independent of alcohol intake. Therefore, the observed alcohol-related associations should be interpreted cautiously and not as evidence of an isolated alcohol-specific effect. Nevertheless, the present findings may suggest a possible association between alcohol intake and longitudinal pituitary morphometric changes.
Although age was not a significant predictor, the interval from baseline was negatively associated with pituitary area change (β = −0.44 per year, P < 0.01), indicating progressive reduction within individuals over time. This longitudinal effect likely reflects the same age-related decline reported in earlier MRI studies, including a 1990 report showing an inverse correlation between age and pituitary volume, particularly after age 50 [9]. The lack of a between-subject age effect in this cohort may relate to its limited age range and smaller interindividual variance compared with within-individual change.
Physiological and clinical implications
The observed association between regular alcohol intake and pituitary area decline, as well as the exploratory sex-related differences observed in this study, may be consistent with a prior report suggesting greater vulnerability of female brains to alcohol-related atrophy [13]. The pituitary gland, as part of the central nervous system and a key regulator of hormonal homeostasis, could be susceptible to alcohol-related neurotoxic effects through mechanisms such as vascular compromise, oxidative stress, or direct disruption of hypothalamic–pituitary signaling. Alcohol exposure has been associated with complex and phase-dependent alterations of the HPA axis in prior studies [14]. However, because endocrine assessments were not available in the present study, the observed morphometric findings should not be interpreted as direct evidence of pituitary hormonal dysfunction or HPA axis dysregulation. Moreover, exploratory quadratic modeling suggested a possible nonlinear relationship between alcohol intake and pituitary area change. However, given the modest sample size and borderline statistical significance, the observed inflection point should not be interpreted as a biologically meaningful cutoff.
Limitations
Several limitations should be acknowledged. First, the cohort consisted predominantly of older Asian males undergoing repeated voluntary MRI checkups at a single institution, which may introduce selection bias and limit generalizability. Second, the cohort was predominantly male, and the number of female participants was small, limiting the reliability of sex-specific analyses. Smoking exposure was simplified into a binary never-smoker versus ever-smoker variable and may not fully reflect longitudinal smoking burden or duration. Third, important potential confounders, including BMI, metabolic factors, endocrine status, medications, hormone replacement therapy, hypertension, diabetes mellitus, and other lifestyle-related variables, were not available for analysis. Therefore, substantial residual confounding may remain. Fourth, partial empty sella cases were included if the pituitary gland remained measurable, which may have introduced additional heterogeneity. Fifth, the present study used two-dimensional midsagittal pituitary area measurements rather than dedicated three-dimensional volumetric analysis. This approach may be influenced by slice angulation, head positioning, and manual tracing variability. In addition, formal reliability assessments, including intra-rater and inter-rater reproducibility analyses, were not performed. Finally, the nonlinear analysis of alcohol intake was exploratory and should not be interpreted as establishing a definitive threshold effect.
Future directions
MRI checkup facilities for healthy individuals provide valuable opportunities to investigate longitudinal changes in pituitary morphology. Collaboration and data sharing between institutions could increase sample size and enhance generalizability. Future research should also explore the association between pituitary morphometric changes including substructures (adenohypophysis, neurohypophysis, and stalk) and clinical outcomes such as hormonal alterations.
In conclusion, this longitudinal MRI study demonstrated progressive reduction in pituitary area within the same individuals over time. Exploratory analyses suggested a possible association between alcohol intake and greater pituitary area reduction, although this finding was attenuated after adjustment for baseline pituitary size and should be interpreted cautiously.
Acknowledgments
None to declare.
Financial Disclosure
The author declares that no funds, grants, or other support were received during the preparation of this manuscript.
Conflict of Interest
The author declares no conflict of interest.
Informed Consent
The requirement for informed consent was waived because of the retrospective nature of the study.
Author Contributions
The author confirms sole responsibility for the following: study conception and design, data collection, analysis and interpretation of results, and manuscript preparation.
Data Availability
The datasets generated and/or analyzed during the current study are available from the corresponding author upon reasonable request. The analysis code used in this study is available at https://github.com/HonSou0095/pit2, which includes the Python scripts and Jupyter notebooks used for statistical modeling and figure generation.
| References | ▴Top |
- Berntsen EM, Haukedal MD, Haberg AK. Normative data for pituitary size and volume in the general population between 50 and 66 years. Pituitary. 2021;24(5):737-745.
doi pubmed - Hong S. Morphometric study of the pituitary gland and stalk with emphasis on lifestyle factors. Pituitary. 2025;28(4):89.
doi pubmed - Bonczar M, Wysiadecki G, Ostrowski P, Michalczak M, Plutecki D, Wilk J, Michalik W, et al. The morphology of the pituitary gland: a meta-analysis with implications for diagnostic imaging. Brain Sci. 2023;13(1).
doi pubmed - Noetzli LJ, Panigrahy A, Hyderi A, Dongelyan A, Coates TD, Wood JC. Pituitary iron and volume imaging in healthy controls. AJNR Am J Neuroradiol. 2012;33(2):259-265.
doi pubmed - Fehrenbach U, Jadan A, Auer TA, Kreutz K, Geisel D, Ziagaki A, Bobbert T, et al. Obesity and pituitary gland volume - a correlation study using three-dimensional magnetic resonance imaging. Neuroradiol J. 2020;33(5):400-409.
doi pubmed - Gurok MG, Tabara MF, Koc M, Saritoy S, Baykara S, Atmaca M. Pituitary volumes are reduced in patients with alcohol use disorder. Alcohol Alcohol. 2023;58(1):107-112.
doi pubmed - Puliani G, Sbardella E, Cozzolino A, Sada V, Tozzi R, Andreoli C, Fiorelli M, et al. Pituitary T1 signal intensity at magnetic resonance imaging is reduced in patients with obesity: results from the CHIASM study. Int J Obes (Lond). 2023;47(10):948-955.
doi pubmed - Takahashi T, Zhou SY, Nakamura K, Tanino R, Furuichi A, Kido M, Kawasaki Y, et al. Longitudinal volume changes of the pituitary gland in patients with schizotypal disorder and first-episode schizophrenia. Prog Neuropsychopharmacol Biol Psychiatry. 2011;35(1):177-183.
doi pubmed - Lurie SN, Doraiswamy PM, Husain MM, Boyko OB, Ellinwood EH, Jr., Figiel GS, Krishnan KR. In vivo assessment of pituitary gland volume with magnetic resonance imaging: the effect of age. J Clin Endocrinol Metab. 1990;71(2):505-508.
doi pubmed - Chakrabarty BK, Sud K, Ganguli P, Khan SA. Assessment of early morning serum cortisol levels in adult male patients with alcohol-related disorders. Med J Armed Forces India. 2022;78(1):47-53.
doi pubmed - Georgakouli K, Manthou E, Fatouros IG, Deli CK, Koutedakis Y, Theodorakis Y, Jamurtas AZ. HPA-axis activity and nutritional status correlation in individuals with alcohol use disorder. Nutrients. 2022;14(23):4978.
doi pubmed - Daviet R, Aydogan G, Jagannathan K, Spilka N, Koellinger PD, Kranzler HR, Nave G, et al. Associations between alcohol consumption and gray and white matter volumes in the UK Biobank. Nat Commun. 2022;13(1):1175.
doi pubmed - Hommer D, Momenan R, Kaiser E, Rawlings R. Evidence for a gender-related effect of alcoholism on brain volumes. Am J Psychiatry. 2001;158(2):198-204.
doi pubmed - Adinoff B, Iranmanesh A, Veldhuis J, Fisher L. Disturbances of the stress response: the role of the HPA axis during alcohol withdrawal and abstinence. Alcohol Health Res World. 1998;22(1):67-72.
pubmed
This article is distributed under the terms of the Creative Commons Attribution 4.0 International License (CC BY 4.0), which permits unrestricted use, distribution, and reproduction in any medium, including commercial use, provided the original work is properly cited.
Journal of Neurology Research is published by Elmer Press Inc.